Back to 3. Add more Chapters
Continue to 5. Control Map dashbord state
4.1. Add Map dashboard
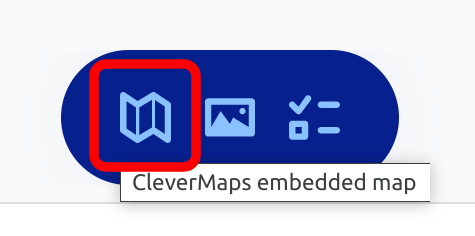
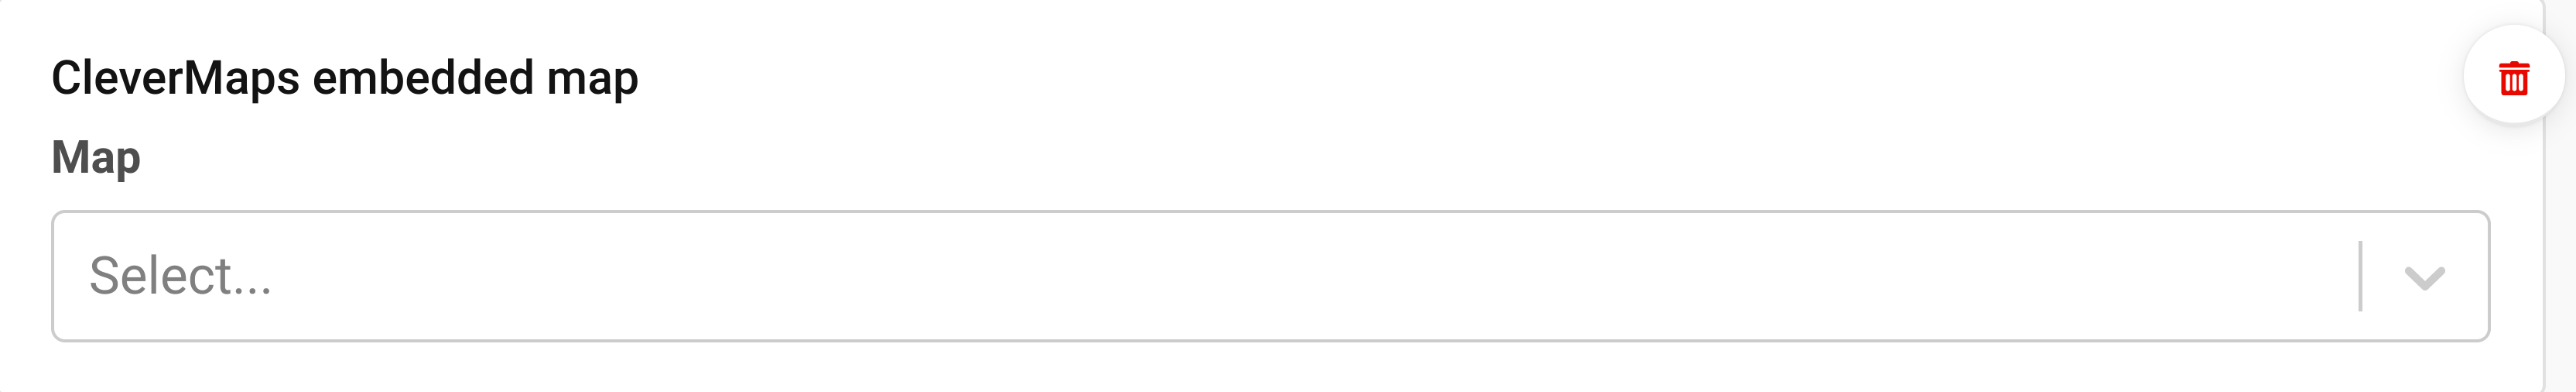
Click into the content editor and a blue menu appears. To add a map dashboard, click folded map icon. Selector of project map dashboards (also called views) appears. Selector contains map dashboards only from the project on which this story is built on top of. Note: In this step Story is automatically saved.
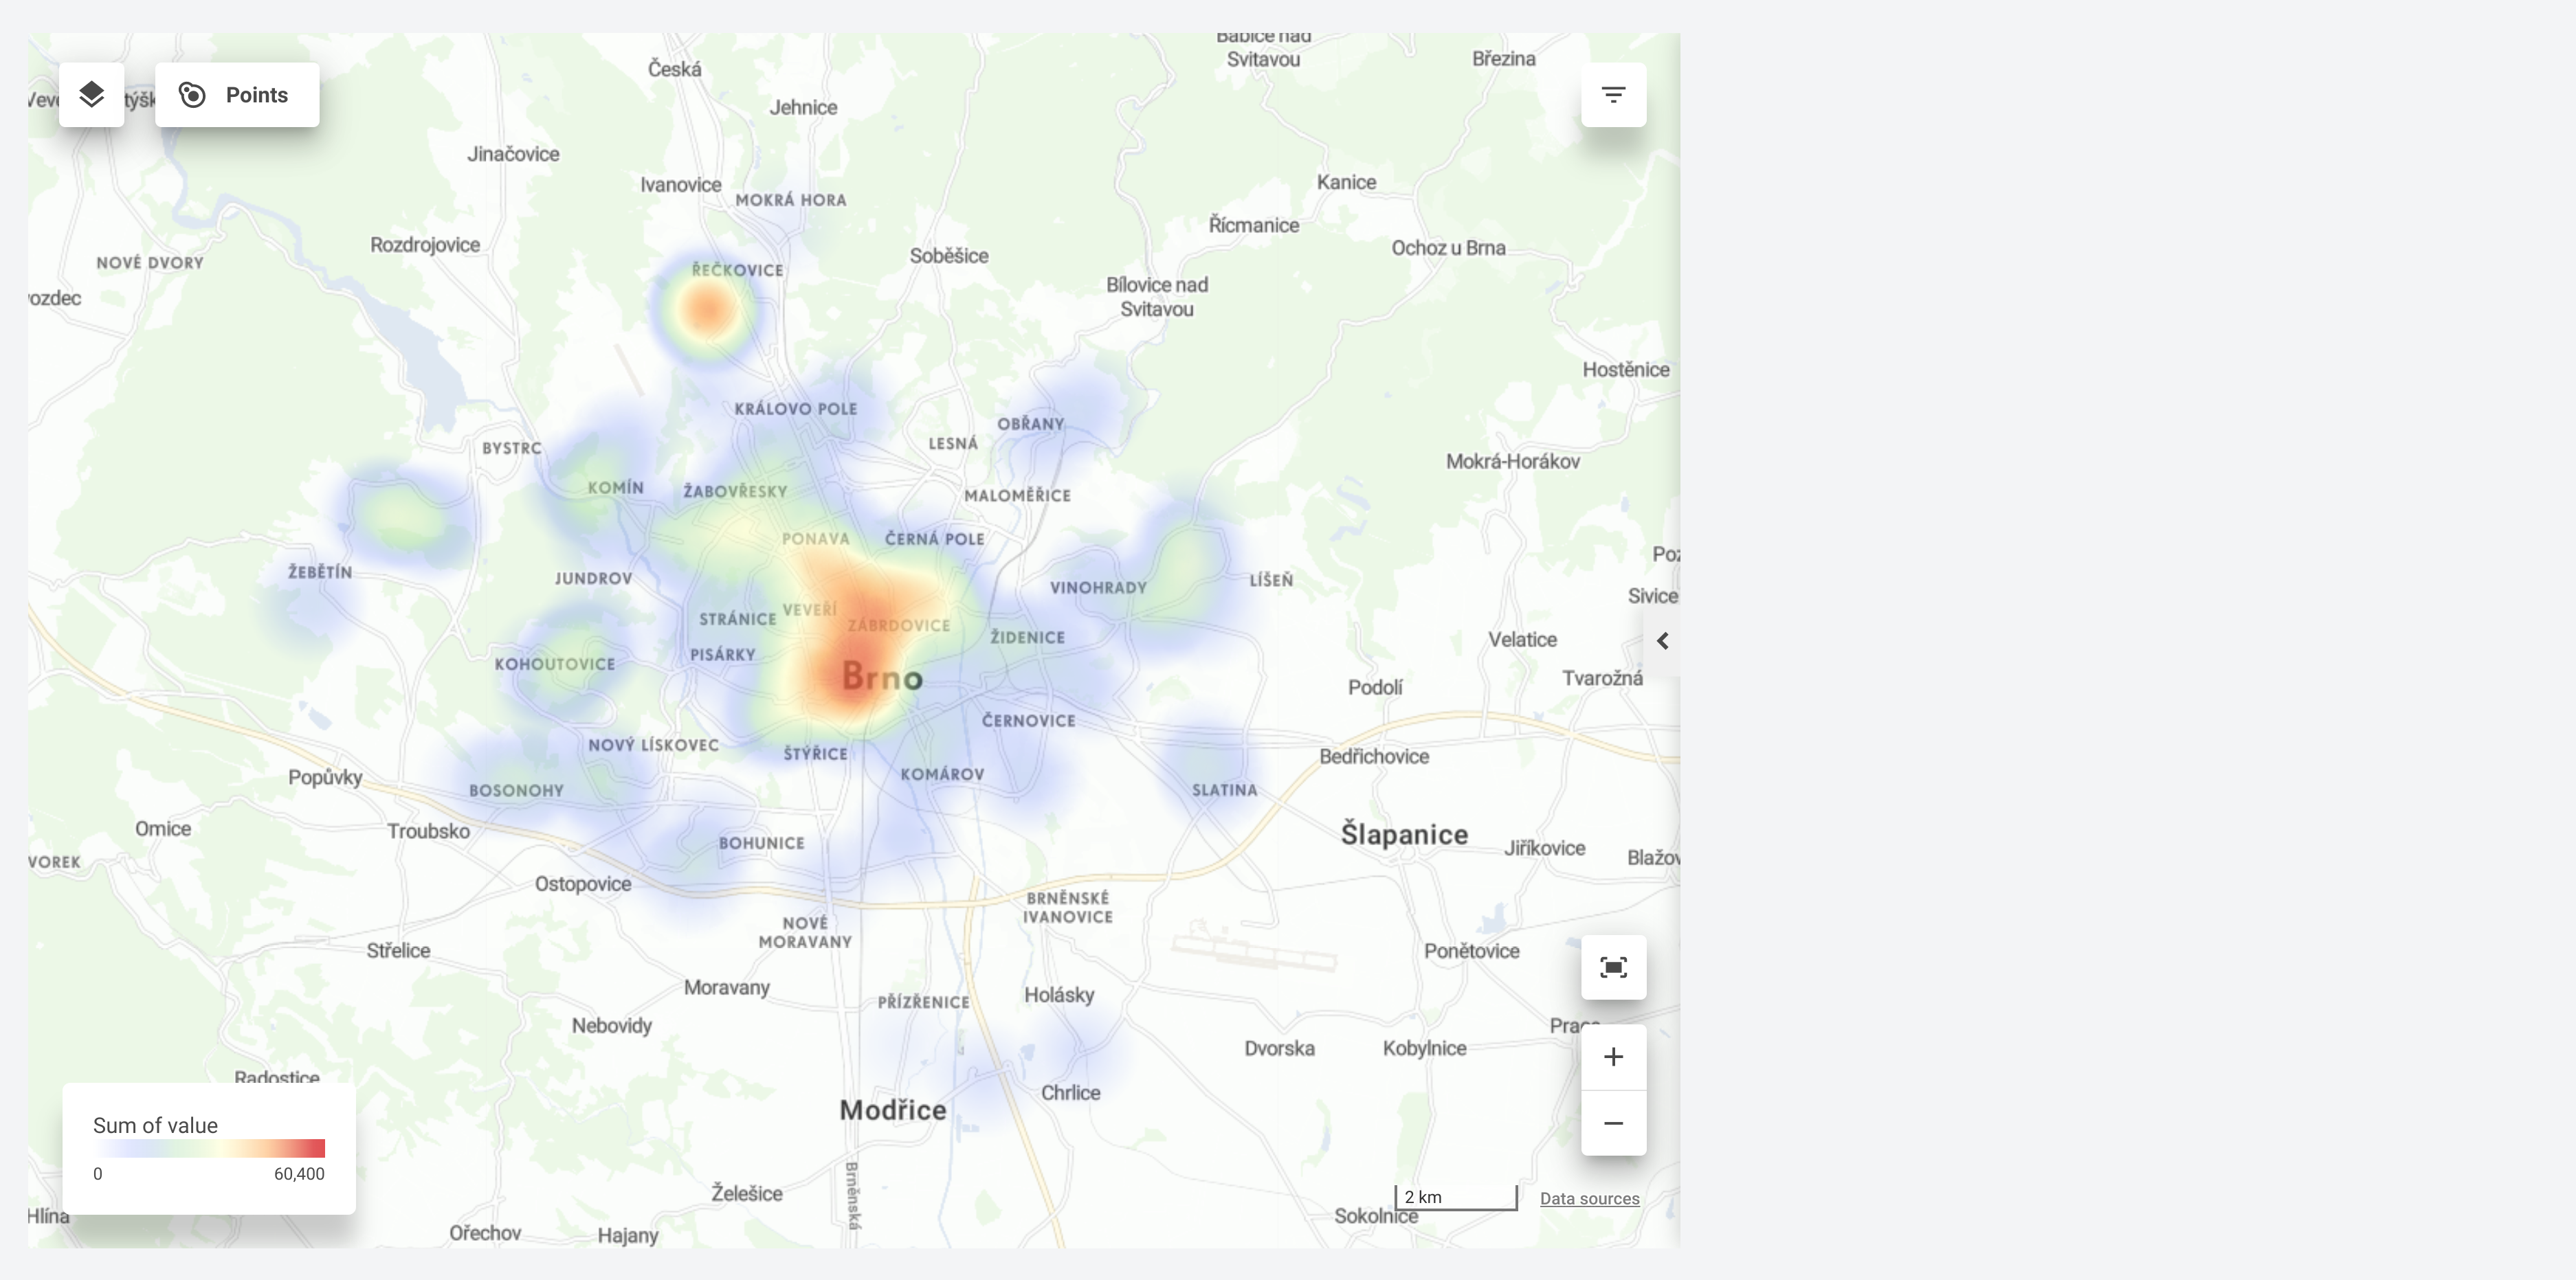
Try to include the Map dashboard which you’ve created in Prerequisites. It is called “Points overview“. Then click “View chapter“ to see the result.
4.2. Embedded map dashboard card
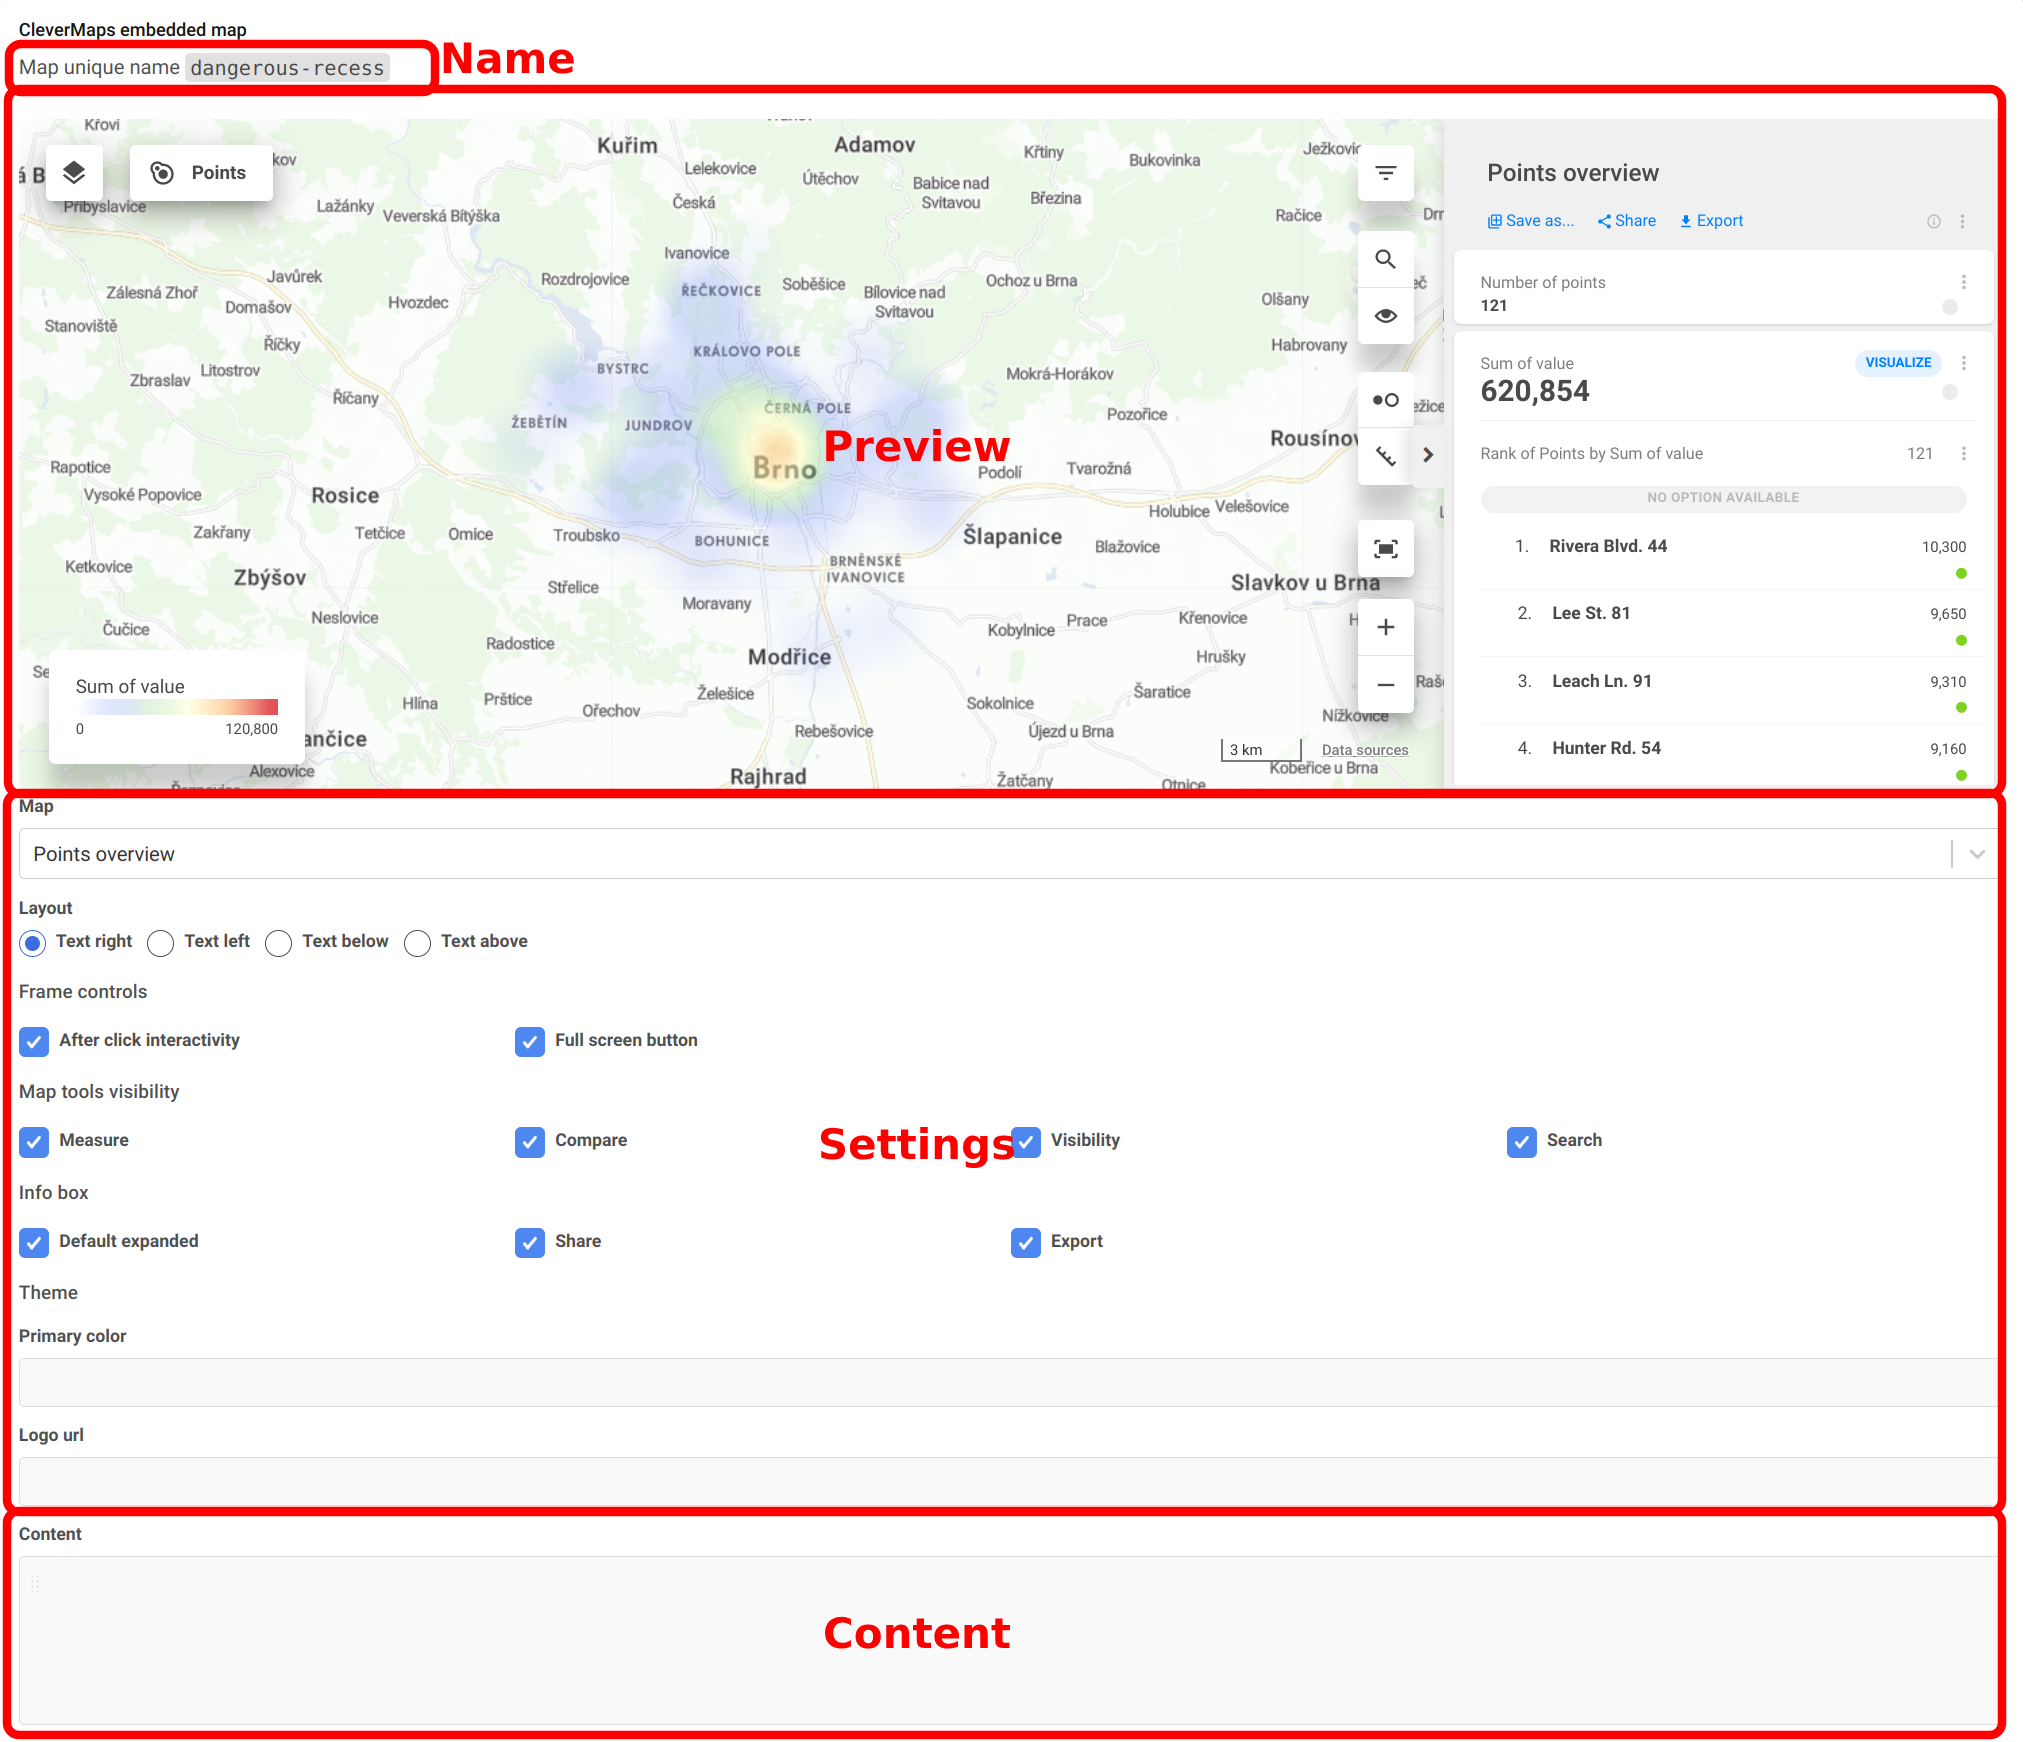
Each embedded map dashboard has its generated unique name. In this case, it is dangerous-recess, but yours will be different. It exists because one map dashboard from Studio may be embedded multiple times within a single story. We need to distinguish them. You will see later why. It is displayed on the top of the embedded map dashboard card.
Under the name, there is a live map dashboard preview. The preview updates based on selected settings every time you click the Save button.
Embedded map dashboard settings follow. You can change the content layout, visibility of tools, theme and more. Keep reading to find out more.
4.3. Map dashboard settings
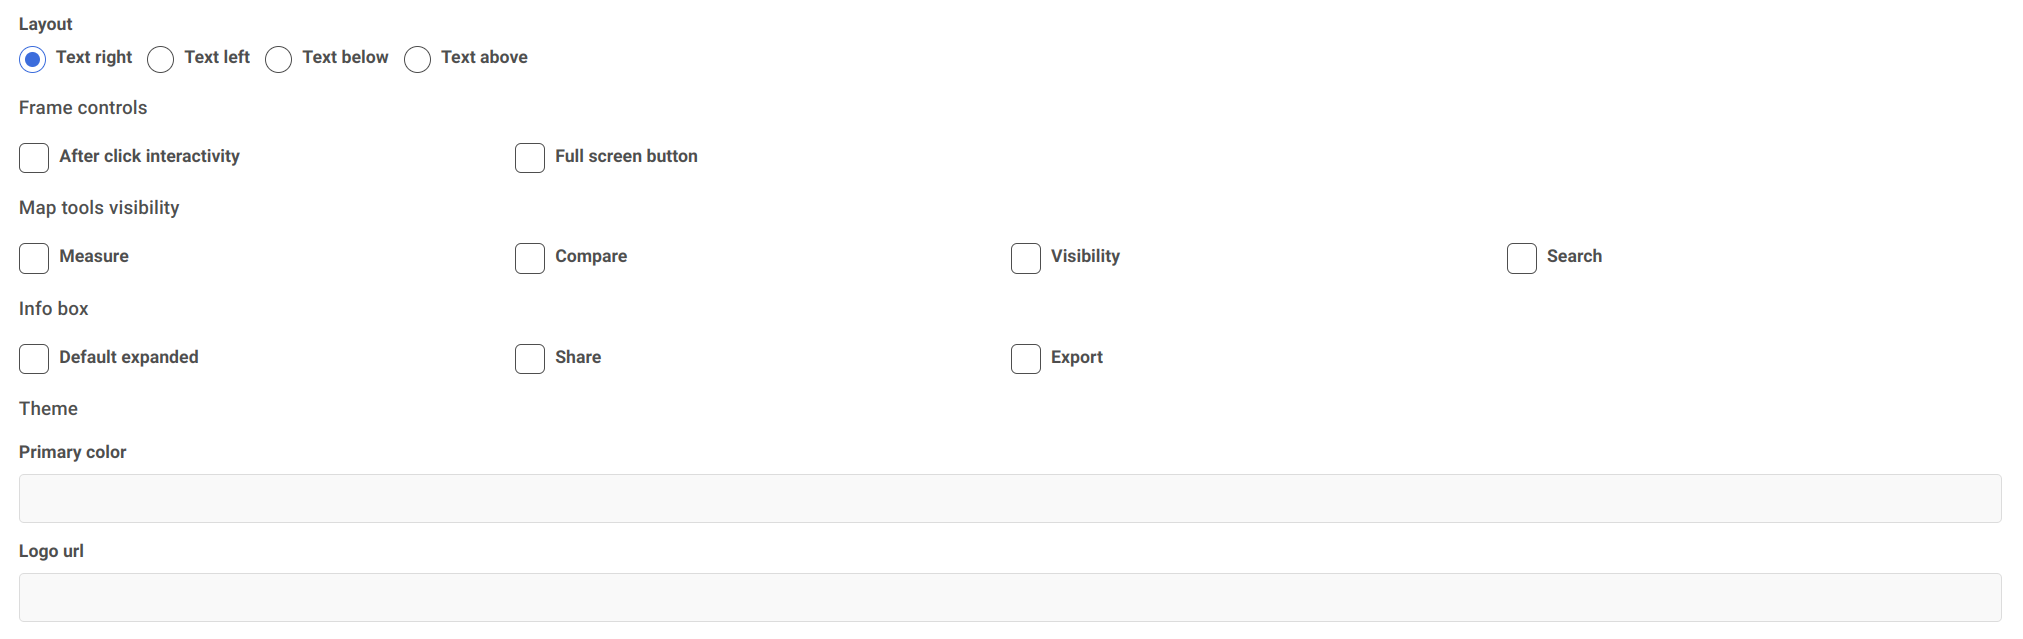
Layout setting changes how the map and additional related content are positioned.
"After click interactivity" controls a grey curtain over the map, which disables mouse events on a map unless the user clicks. It is because users may have problems scrolling story content over the map because the map catches scrolling and zooms the map instead of scrolling content. Turn it on if you expect scrolling will be more frequent (the map is more for visualization and less for interactivity, and there is a lot of content around). Turn it off when you expect your users will interact a lot with the map, and the map is the main element in the content.
A full-screen button is in the top right corner of each map dashboard. You can hide it to make the UI clean. Similarly, you may hide other buttons and elements.
You may also collapse the whole dashboard on the side of a map.
Lastly, changing the main colour by filling in hexadecimal values and loading the logo to fit the story with your brand is possible. Note: The logo must be uploaded to dedicated storage by the CleverMaps team. Contact us at support@clevermaps.io if you need it.
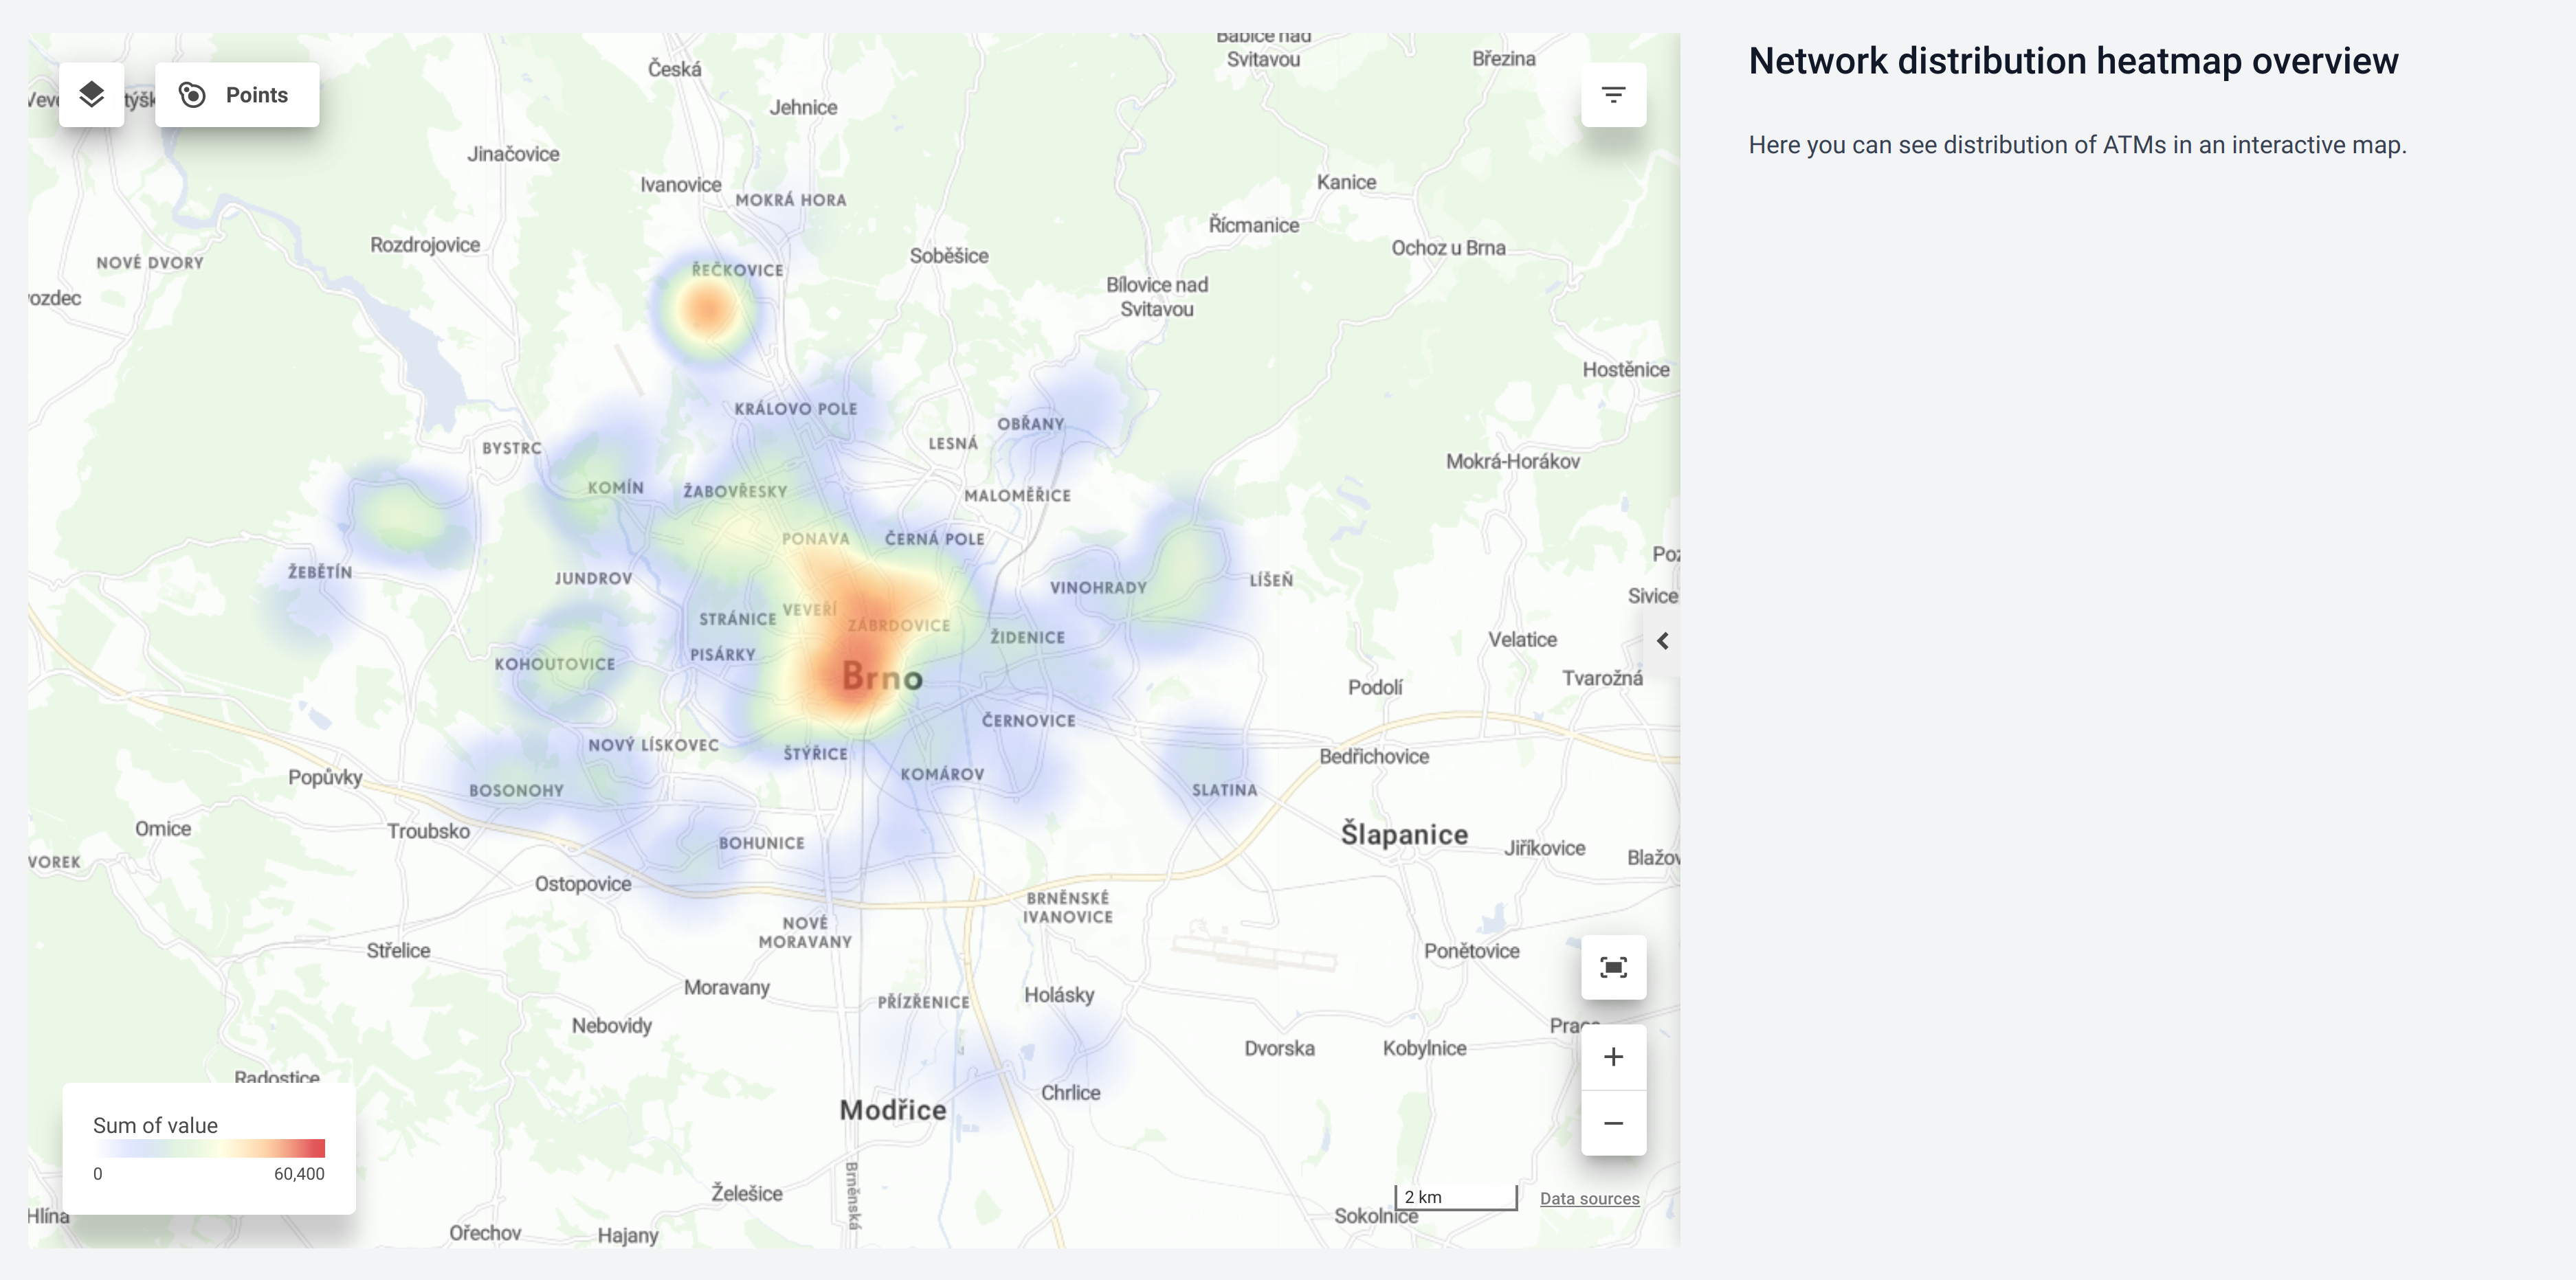
Try to make a clean map with the least amount of additional controls. Don’t forget to click “Save“ and “View Story“. You should end up with the same result as captured in the screenshot on the side. Notice the empty content on the right side. It is because of layout set content to be on the right.
4.4. Map dashboard content
Each embedded map may have some additional related content. It works the same as regular story content, as described in 2. Add basic content. The main advantage is that it allows splitting the map and content into columns.
Try to add the heading “Network distribution heatmap overview“ and the text “Here you can see a distribution of ATMs in an interactive map ".
Back to 3. Add more Chapters
Continue to 5. Control Map dashbord state