We highly recommend understanding Main Concepts first. (3 min read)
The web application used to build and manage Stories. Think of a Story as an interactive document consisting of text, charts, Map Dashboards and filters. It is meant to be used to present the results of the analysis. Using available Map Dashboards, describe findings, correlations, fluctuations, peculiarities, etc. So managers can gain easy-to-digest information and make Informed Decisions.
Product vision and goal
We believe even a sufficient amount of information is not enough to make informed decisions. From our practice, decision-makers need specific solution proposals based on the information derived from reliable data together with interpretation.
Unlike Map Dashboards from Studio, Story is a single-purpose product. It is created to support a specific decision. Therefore, we aim for Stories to be quick and easy to build.
Stories builder is a visual editor developed to quickly put together solution proposals, geospatial analysis results and their interpretation on top of Studios map dashboards.
What is Story
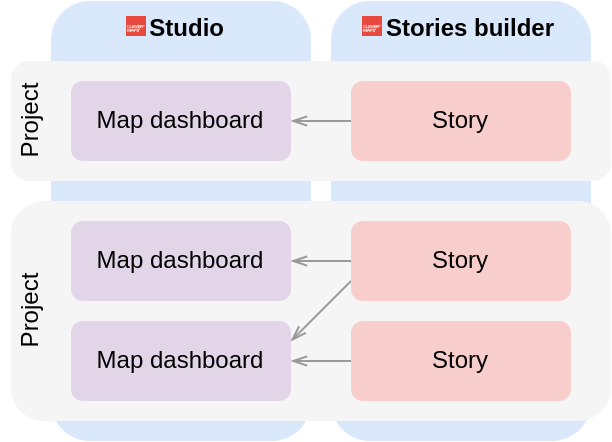
The Story is an interactive document which allows embedding map dashboards from Studio. The Story is built on top of the CleverMaps project, respectively, one CleverMaps project may have several Stories. Stories builder also shares user accounts with Studio and Semantic layer. If you have already signed up to Studio, you may use the same account to access Stories builder and vice versa.
More about projects and user accounts in CleverMaps Platform
Each Story consists of one Home chapter and any number of additional chapters. Each chapter contains formatted text, pictures, videos and, most importantly, embedded map dashboards which can be controlled by state-changing links or filters.
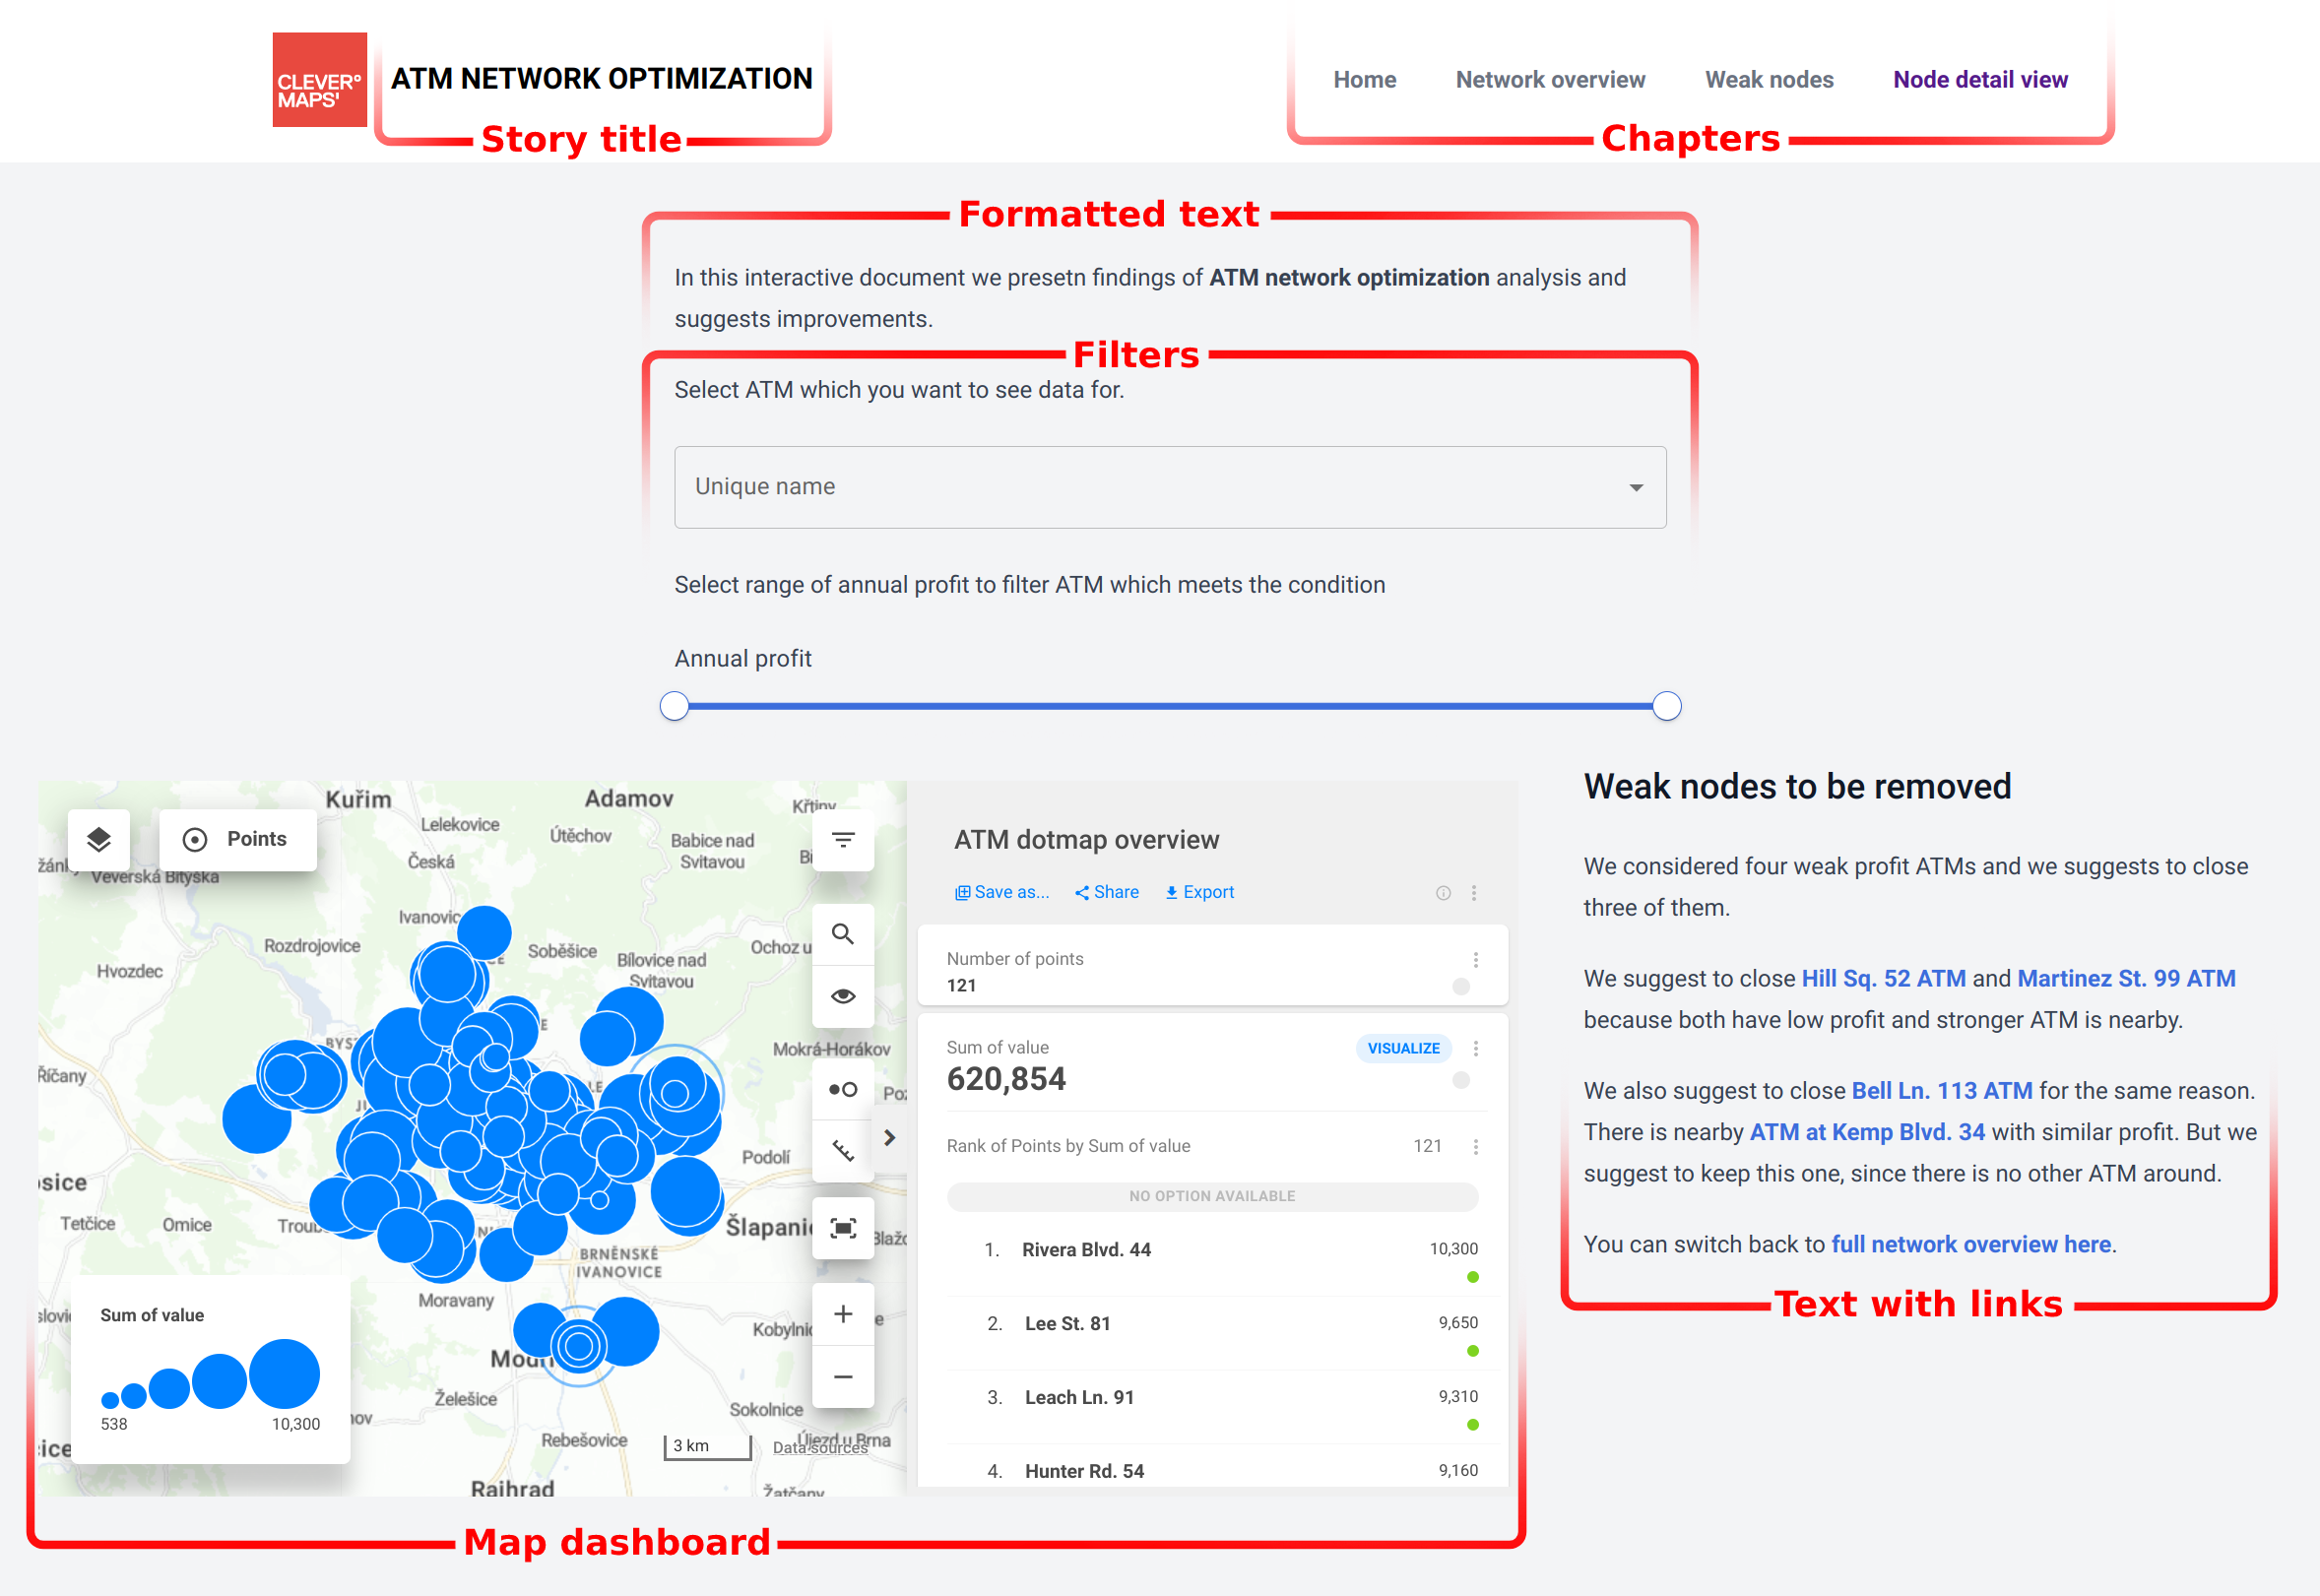
State-changing links are links within a text which change the map dashboard state. Map dashboard states are prepared in advance by a person who writes a story. When a reader clicks the link, it changes the map dashboard visualization. It is useful when the user is reading about findings, interpretations or suggestions, they can click the link and the described phenomenon is shown beside.
Filters truncate map dashboard data. There are 5 types of filters - Checkboxes, Multi-select, Radios, Single select and Range. They control filters in the Studio map dashboard. It is useful e.g. when you want to show data for just one selected object (store, restaurant, place, ATM, delivery box, etc.).
Continue to Tutorial (Stories builder)