A metric is an expression which describes a computation that will be performed over the project's data. Metrics are written in a custom JSON query language, which is fairly simple and doesn't require users to know SQL. A metric written in this language is then translated to SQL by a backend service and executed as multidimensional query on data warehouse.
A metric is visualised on the map using an indicator, in which it is referenced by URL.
All properties used in metrics are dataset properties, located in dwh.ref.properties. On these properties, a set of functions can be applied. They can be nested, and the results of these functions can be combined and filtered. For better maintainability, metrics can be composed of other metrics.
Syntax
This is the simplest type of metric. It returns the sum (function_sum) of all basket amounts (property baskets.amount).
All available functions and operators are described below.
Turnover metric object syntax
{
    "name": "turnover_metric",
    "type": "metric",
    "content": {
        "type": "function_sum",
        "content": [
            {
                "type": "property",
                "value": "baskets.amount"
            }
        ]
    }
}
Example of a dumped metric
{
    "url": "/rest/projects/yufqzxkbiecj7jot/md/metrics/efea9kgccehnnt2n",
    "dumpTime": "2018-01-31T15:07:37Z",
    "version": "0",
    "content": {
        "id": "efea9kgccehnnt2n",
        "name": "turnover_metric",
        "type": "metric",
        "content": {
            "type": "function_sum",
            "content": [
                {
                    "type": "property",
                    "value": "baskets.amount"
                }
            ]
        },
        "accessInfo": {
            "createdAt": "2017-10-05T08:27:06Z"
        },
        "links": [
            {
                "rel": "self",
                "href": "/rest/projects/yufqzxkbiecj7jot/md/metrics/efea9kgccehnnt2n"
            }
        ]
    }
}
Additional syntax examples
Important - to properly understand metrics, please see these examples below.
For a list of examples of different metrics, see the Metrics cheatsheet article.
Offline turnover metric object syntax
{
    "name": "offline_turnover_metric",
    "type": "metric",
    "content": {
        "type": "function_sum",
        "content": [
            {
                "type": "property",
                "value": "baskets.amount"
            }
        ],
        "options": {
            "filterBy": [
                {
                    "property": "baskets.on_off_name",
                    "value": "Offline",
                    "operator": "eq"
                }
            ]
        }
    }
}
This metric extends the metric from the first example by filtering. The filter is defined in options.filterBy object filters the baskets.on_off_name property with an eq operator - so the metric computes the turnover of baskets ordered offline.
All metrics can have an arbitrary number of filters.
Purchases per customer metric object syntax
{
    "name": "purchases_customer_metric",
    "type": "metric",
    "content": {
        "type": "function_divide",
        "content": [
            {
                "type": "function_count",
                "content": [
                    {
                        "type": "property",
                        "value": "baskets.basket_id"
                    }
                ]
            },
            {
                "type": "function_count",
                "content": [
                    {
                        "type": "property",
                        "value": "clients.client_id"
                    }
                ]
            }
        ]
    }
}
Let's have a look at a more complex example. This metric computes the number of purchases per customer.
Consider this metric a fraction. On the top level, the aggregate function is function_divide, which represents a fraction bar. The numerator here is a function_count of the number of baskets, and the denominator is the count of all clients.
Market penetration metric object syntax
{
    "name": "market_penetration_metric",
    "type": "metric",
    "content": {
        "type": "function_ifnull",
        "content": [
            {
                "type": "function_divide",
                "content": [
                    {
                        "type": "function_count",
                        "content": [
                            {
                                "type": "property",
                                "value": "clients.client_id"
                            }
                        ]
                    },
                    {
                        "type": "function_sum",
                        "content": [
                            {
                                "type": "property",
                                "value": "demography_postcode.households"
                            }
                        ],
                        "options": {
                            "withoutFilters": [
                                "dim_dates.*"
                            ]
                        }
                    }
                ]
            },
            {
                "type": "number",
                "value": 0.0
            }
        ]
    }
}
This metric computes the penetration of the market. Market penetration is computed as a number of customers, divided by the sum of the number of households. This example demonstrates the use of withoutFilters. In our view, we have defined a globalDate filter which filters the dim_dates.date_iso property. There is no way to link the dim_dates and demography_postcode datasets, yet they both appear in one metric. To evade an error of finding a non-existent join path between these datasets, we use withoutFilters on all properties of the dim_dates dataset.
Another thing to note here is the use of function_ifnull. If the result of the function_divide should be null (e.g. in case of division by zero), the result of the metric in that case will be 0.0.
Population where revenue is greater than 10000 metric syntax
{
    "name": "population_where_revenue_gt_10000",
    "type": "metric",
    "content": {
        "type": "function_sum",
        "content": [
            {
                "type": "property",
                "value": "demography.population"
            }
        ],
        "options": {
            "filterBy": [
                {
                    "operator": "inAttribute",
                    "property": "wards.ward_id",
                    "query": {
                        "properties": [
                            {
                                "id": "ward_id",
                                "type": "property",
                                "value": "wards.ward_id"
                            },
                            {
                                "id": "transaction_sum",
                                "type": "function_sum",
                                "content": [
                                    {
                                        "type": "property",
                                        "value": "transactions.value"
                                    }
                                ]
                            }
                        ],
                        "having": [
                            {
                                "operator": "gt",
                                "propertyId": "transaction_sum",
                                "value": 10000
                            }
                        ]
                    }
                }
            ],
            "withoutFilters": [
                "transactions.store_id"
            ]
        }
    }
}
This metric computes the population in areas where the turnover is greater than 10000 (given that the contents of the demography dataset are computed to the ward level).
This metric uses the inAttribute operator, which is a specific operator that allows you to filter the metric based on the result of another metric (query). This query is specified in the filterBy.query object. This functionality - filtering areas based on the result of a different query - is also available in the form of indicator filters defined in the view object.
Arrivals metric
{
    "name": "arrivals_metric",
    "type": "metric",
    "content": {
        "type": "function_sum",
        "content": [
            {
                "type": "property",
                "value": "departures_arrivals.arrivals"
            }
        ],
        "options": {
            "withoutFilters": [
                "*.*"
            ],
            "filterBy": [
                {
                    "property": "departures_arrivals.source_country",
                    "query": {
                        "properties": [
                            {
                                "id": "country_name",
                                "type": "property",
                                "value": "countries_dwh.country_name"
                            },
                            {
                                "id": "aux_count",
                                "type": "function_count",
                                "content": [
                                    {
                                        "type": "property",
                                        "value": "countries_dwh.country_name"
                                    }
                                ],
                                "options": {
                                    "withoutFilters": [
                                        "countries_dwh.x_*",
                                        "countries_dwh.y_*"
                                    ]
                                }
                            }
                        ],
                        "having": [
                            {
                                "propertyId": "aux_count",
                                "value": 0,
                                "operator": "gte"
                            }
                        ]
                    },
                    "operator": "inAttribute"
                },
                {
                    "property": "departures_arrivals.arrivals",
                    "value": 0,
                    "operator": "gt"
                }
            ]
        }
    }
}
Departures metric
{
    "name": "departures_metric",
    "type": "metric",
    "content": {
        "type": "function_sum",
        "content": [
            {
                "type": "property",
                "value": "departures_arrivals.departures"
            }
        ],
        "options": {
            "withoutFilters": [
                "*.*"
            ],
            "filterBy": [
                {
                    "property": "departures_arrivals.destination_country",
                    "query": {
                        "properties": [
                            {
                                "id": "country_name",
                                "type": "property",
                                "value": "countries_dwh.country_name"
                            },
                            {
                                "id": "aux_count",
                                "type": "function_count",
                                "content": [
                                    {
                                        "type": "property",
                                        "value": "countries_dwh.country_name"
                                    }
                                ],
                                "options": {
                                    "withoutFilters": [
                                        "countries_dwh.x_*",
                                        "countries_dwh.y_*"
                                    ]
                                }
                            }
                        ],
                        "having": [
                            {
                                "propertyId": "aux_count",
                                "value": 0,
                                "operator": "gte"
                            }
                        ]
                    },
                    "operator": "inAttribute"
                },
                {
                    "property": "departures_arrivals.departures",
                    "value": 0,
                    "operator": "gt"
                }
            ]
        }
    }
}
Arrivals/departures metrics compute the number of, e.g. people which have arrived to or departed from a destination. Whether it is a country, a city, (polygon) or a shop (marker). The syntax of these two metrics is very similar. Apart from this specific syntax, a indicator.content.relations.reversedMetric must be specified in the corresponding indicator:
Arrivals indicator
{
    "name": "arrivals_indicator",
    "type": "indicator",
    "title": "Arrivals",
    "description": "Daily arrivals to a specific country",
    "content": {
        "metric": "/rest/projects/$projectId/md/metrics?name=arrivals_metric",
        "scale": "standard",
        "distribution": "geometric",
        "format": {
            "type": "number",
            "fraction": 0
        },
        "relations": {
            "type": "self",
            "reversedMetric": "/rest/projects/$projectId/md/metrics?name=departures_metric"
        }
    }
}
And vice versa for destinations_indicator.
Also, the data which these metrics work with must have a specific format - mirrored pairs with values for each source/destination node:
|
id |
source_country |
destination_country |
arrivals |
departures |
|---|---|---|---|---|
|
1 |
USA |
Canada |
20 000 |
8 000 |
|
2 |
Canada |
USA |
8 000 |
20 000 |
|
3 |
USA |
United Kingdom |
32 000 |
18 500 |
|
4 |
United Kingdom |
USA |
18 500 |
32 000 |
Metric with variable syntax
{
    "name": "exposure_index_metric",
    "type": "metric",
    "content": {
        "type": "function_multiply",
        "content": [
            {
                "type": "function_sum",
                "content": [
                    {
                        "type": "property",
                        "value": "poi.point_value"
                    }
                ]
            },
            {
                "type": "variable",
                "value": "index_variable"
            }
        ]
    }
}
This is a metric which uses metric variables. The resulting sum of an exposure index is simply multiplied by the value substituted in the index_variable. The variables are set in the variables filter in the view object.
For better maintainability, metrics can be composed of other metrics. The following example shows a new offline_turnover_ratio_metric that reuses two already-defined metrics:
Reuse of metric syntax
{
    "name": "offline_turnover_ratio_metric",
    "type": "metric",
    "content": {
        "type": "function_divide",
        "content": [
            {
                "type": "metric",
                "metric": "/rest/projects/$projectId/md/metrics?name=offline_turnover_metric"
            },
            {
                "type": "metric",
                "metric": "/rest/projects/$projectId/md/metrics?name=turnover_metric"
            }
        ]
    }
}
Key description
content
|
Key |
Type |
Optionality |
Description |
Constraints |
|---|---|---|---|---|
|
|
string |
REQUIRED |
dwh query property, dwh query function, or a number |
|
|
|
array |
REQUIRED |
array of dwh property definitions (see the content.content table) |
|
|
|
object |
optional |
function options, allows to specify filters |
|
content.content
|
Key |
Type |
Optionality |
Description |
Constraints |
|---|---|---|---|---|
|
|
string |
optional |
choose a custom string identifier for the query property |
|
|
|
string |
REQUIRED |
dwh query property, dwh query function, or a number |
|
|
|
string long decimal |
REQUIRED |
string identifier of a dataset property, which the function will be applied to (for string with variable name (for long or decimal value (for |
|
content.options
|
Key |
Type |
Supported by function types |
Optionality |
Description |
Constraints |
|---|---|---|---|---|---|
|
|
array |
optional |
specifies datasets which the metric will be aggregated to if specified, always |
[null] |
|
|
|
array |
All function types |
optional |
specifies datasets which the metric is allowed to be aggregated to array of dataset names, or name prefixes (with the For nested metrics, only the |
|
|
|
array |
All function types |
optional |
specifies datasets which the metric is not allowed to be aggregated to array of dataset names, or name prefixes (with the For nested metrics, only the |
|
|
|
array |
optional |
specifies dataset properties not to be explicitly joined into the final query array of dataset properties. The syntax |
|
|
|
|
array |
optional |
specifies dataset properties to be explicitly joined into the final query array of dataset properties. The syntax |
|
|
|
|
object |
optional |
object specifying the filter of the metric |
|
|
|
|
integer |
|
optional |
the number of places to round the metric result to |
|
|
|
integer |
REQUIRED |
number of buckets (approximately equal groups) to break the result set into |
|
|
|
|
string |
optional |
define how to sort input values |
|
|
|
|
array |
|
optional |
list of dataset properties to be partioned by |
|
|
|
string |
REQUIRED |
name of geometryPoint dataset |
|
|
|
|
integer |
|
REQUIRED |
specify H3 grid resolution |
|
|
|
object |
|
REQUIRED |
object defining a static |
|
Detailed options description
aggregateBy:
Specifies datasets which the metric will be aggregated to, usually some administrative unit - district, ward, etc.
So far, only null is implemented. That means, do not aggregate to any datasets. For example, we'd like to see a metric that computes the turnover share of one administrative unit, in comparison to the total turnover. Syntax of this metric would be:
Metric with aggregateBy example
{
    "name": "turnover_share_metric",
    "type": "metric",
    "content": {
        "type": "function_divide",
        "content": [
            {
                "type": "function_sum",
                "content": [
                    {
                        "type": "property",
                        "value": "transactions.transaction_size"
                    }
                ]
            },
            {
                "type": "function_sum",
                "content": [
                    {
                        "type": "property",
                        "value": "transactions.transaction_size"
                    }
                ],
                "options": {
                    "aggregateBy": [
                        null
                    ]
                }
            }
        ]
    }
}
acceptAggregateBy and dontAggregateBy:
Specify datasets which the metric is allowed/not allowed to be aggregated to, usually some administrative unit - district, ward, etc.
Some metrics are not computable when aggregated to certain datasets. Say we have a 3-level hierarchical administrative units - districts, wards and postcodes. But the business data is available only up to the 2nd level - wards.
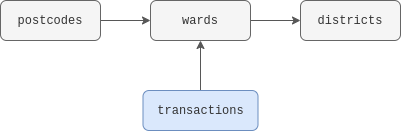
When aggregating to the 3rd level (selecting the postcodes granularity), the metric would not be computable and respective indicator would show the "N/A" result. To avoid this, use acceptAggregateBy or dontAggregateBy.
Metric with acceptAggregateBy example
{
    "name": "turnover_value_metric",
    "type": "metric",
    "content": {
        "type": "function_sum",
        "content": [
            {
                "type": "property",
                "value": "transactions.transaction_size"
            }
        ],
        "options": {
            "acceptAggregateBy": [
                "districts",
                "wards"
            ]
        }
    }
}
Metric with dontAggregateBy example
{
    "name": "turnover_value_metric",
    "type": "metric",
    "content": {
        "type": "function_sum",
        "content": [
            {
                "type": "property",
                "value": "transactions.transaction_size"
            }
        ],
        "options": {
            "dontAggregateBy": [
                "postcodes"
            ]
        }
    }
}
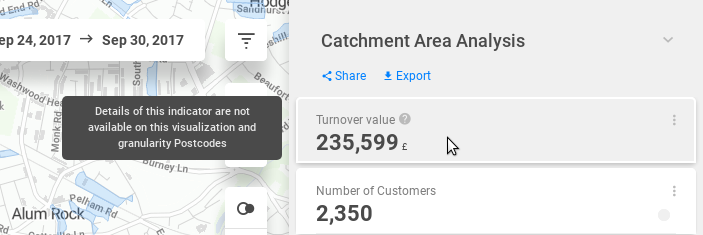
Using these options, the indicator card will show an explanation of why is there no metric result.
_
withoutFilters has 3 use cases:
-
If the map is zoomed in on a certain level, the map window has its bounding box properties. In this case,
withoutFiltersis used to not apply the filter to the areas which are out of the current bounding box. This is a performance improvement. -
If there is an strictly defined metric e.g. "total number of customers", as shown in the example below. After applying a filter, the result of this metric wouldn't make sense. So here,
withoutFiltersprevents these possible semantic issues. -
In an indicator, two tables can have a relationship through a catchment area - e.g. the demography of, and the orders made in a certain county. These tables however, are not linked through foreign key, and thus cannot be explicitly joined. If we apply a filter to this indicator, using
withoutFilters, we can prevent errors of not finding the join path between orders and demography. This is more of an error evasion technique.
Both withoutFilters and acceptFilters may contain:
-
specific dataset properties
"clients.client_id" -
wildcard on all dataset properties
"clients.*" -
multiple datasets, e.g.
"dim_dates*.*"(this would filter out all datasets from the can-dim-dates dimension) -
all datasets
"*.*"
The behaviour of the acceptFilters array is the opposite of withoutFilters. Because sometimes, it is much simpler to define a list of filters to be accepted than those to be ignored.
An example can be seen above in the "Market penetration metric object syntax" code excerpt.
content.options.filterBy
filterBy is a versatile object that provides various ways of filtering the result of the metric.
|
Key |
Type |
Optionality |
Description |
Constraints |
|---|---|---|---|---|
|
|
string |
REQUIRED |
identifier of a dataset property, which the filter will be applied to |
|
|
|
string long decimal boolean |
VARIES |
value, by which the property will be filtered this key is polymorphic - it doesn't have only one type it can also be a single value, or an array:
|
|
|
|
object |
VARIES |
query, by which the property will be filtered (see the content.content table) |
|
|
|
object |
REQUIRED |
the operator that will be used by the filter see the available filterBy operators |
|
filterBy examples
filterBy syntax excerpt with string value and eq operator
    "filterBy": [
        {
            "property": "shops.type",
            "value": "partner",
            "operator": "eq"
        }
    ]
filterBy syntax excerpt with integer value and lte operator
    "filterBy": [
        {
            "property": "baskets.amount",
            "value": 100,
            "operator": "lte"
        }
    ]
filterBy syntax excerpt with an array of string values and in operator
    "filterBy": [
        {
            "property": "baskets.day_of_week",
            "value": [
                "Monday",
                "Tuesday",
                "Wednesday",
                "Thursday",
                "Friday"
            ],
            "operator": "in"
        }
    ]
DWH query function list
Aggregate functions
Aggregate functions compute a single result from a set of input values.
|
Identifier |
Description |
Example |
|---|---|---|
|
|
arithmetic average of all input values |
|
|
|
sum of all input values |
|
|
|
distinct count of all input values that are not |
|
|
|
maximum value |
|
|
|
minimum value |
|
|
|
sample standard deviation of the input values |
|
|
|
population standard deviation of the input values |
|
|
|
sample variance of the input values |
|
|
|
population variance of the input values |
|
|
|
|
|
Window functions
Window functions provide the ability to perform calculations across sets of records that are related to the current query record. Functions accept both the aggregation function and the dataset property as parameters.
|
Identifier |
Description |
Example |
|---|---|---|
|
|
integer ranging from 1 to the argument value, dividing the partition as equally as possible |
|
|
|
rank of the current row with gaps |
|
|
|
value below which a given percentage of observations in a group of observations fall |
input values sorted = (105.9, 75.2, 61.1, 42.7, 35.2, 21, 10)
|
|
|
a unique number for each row starting with 1. For rows that have duplicate values, numbers are arbitrary assigned. |
|
|
|
contribution to the total |
|
Arithmetic functions
Basic arithmetic functions.
-
function_plus,function_minusandfunction_multiplyaccept 2 or more arguments -
function_divideandfunction_moduloaccept exactly 2 arguments
|
Identifier |
Example |
|---|---|
|
|
|
|
|
|
|
|
|
|
|
|
|
|
|
Mathematical functions
Basic mathematical functions.
|
Identifier |
Description |
Example |
|---|---|---|
|
|
a rounding function (round to specific number of decimal places) |
|
|
|
a natural logarithm function |
|
|
|
a natural exponential function |
|
Conditional functions
|
Identifier |
Description |
Example |
|---|---|---|
|
|
defines the default value to use if the result of aggregate function is |
|
|
|
returns the greatest or largest value from the list of expressions |
|
|
|
returns the least or smallest value from the list of expressions |
|
Geospatial functions
|
Identifier |
Description |
Example |
|---|---|---|
|
|
computes the H3 grid ID of each record in given GeometryPoints dataset and selected H3 grid resolution |
|
|
|
computes the minimum geodesic distance between given central point and points in GeometryPoints dataset in meters. See example on the right: a dataset |
|
Filter operators list
FilterBy operators
|
Operator |
Description |
Example |
|---|---|---|
|
|
is equal |
|
|
|
negated |
|
|
|
in range |
|
|
|
lower than |
|
|
|
lower than or equal |
|
|
|
greater than |
|
|
|
greater than or equal |
|
|
|
is null |
|
|
|
is not null |
|
|
|
is in attribute |
see the usage in a complete metric example above |
|
|
is not in attribute |
complementary to the |
|
|
radius query in meters from a central point |
|
|
|
the nearest (or N nearest) dataset records to a central point |
|
|
|
generic polygon filter |
|
Logical operators
Allows you to create advanced filters and to combine operators.
|
Identifier |
Description |
|---|---|
|
|
logical conjuction - takes at least two arguments |
|
|
logical disjunction - takes at least two arguments |
|
|
negation - takes one argument |
Example of an or filter selecting all customers that lie within one H3 grid area OR are within 500 meters of a central point:
"filterBy": [
{
"operator": "or",
"content": [
{
"operator": "eq",
"value": "8d195c0238e44bf",
"function": {
"type": "function_h3_grid",
"options": {
"resolution": 13,
"dataset": "customers"
}
}
},
{
  "operator": "distanceLte",
  "dataset": "customers",
  "distance": 500,
  "centralPoint": {
    "lat": 52.4805067,
    "lng": -1.8939561
  }
}
]
}
]
Visual representation
Metrics do not have a visual representation in the application.