We highly recommend understanding Main Concepts first. (3 min read)
Layer connected to Data model,which manages Metric definitions, computation of metric values and caching. The Semantic layer can manage the data model so Data can be filled directly into it or connected to the external data warehouse. The semantic layer is controlled by a command line tool called CleverMaps Shell. All tasks can be performed with provided REST API, which is also used to query the values of a metric. Among others to be consumed by CleverMaps Studio and its Map Dashboards.
CleverMaps Data Model
The logical multidimensional data model is the heart of our platform. It works on the same logic you are used to from standard Business Intelligence tools (data warehousing and OLAP systems), but the CleverMaps one can handle spatial data.
The multidimensional logical data model is used because it has historically proven effective in facilitating data analysis from various perspectives and dimensions. The multidimensional data model is designed to solve complex ad-hoc queries in real-time. This is exactly what CleverMaps Studio needs.
The basic parts of such a multidimensional data model are datasets in the role of a fact table or dimension table. There are existing design principles for organising and optimising multidimensional data (e.g., star schema, snowflake schema, slowly changing dimension etc.)
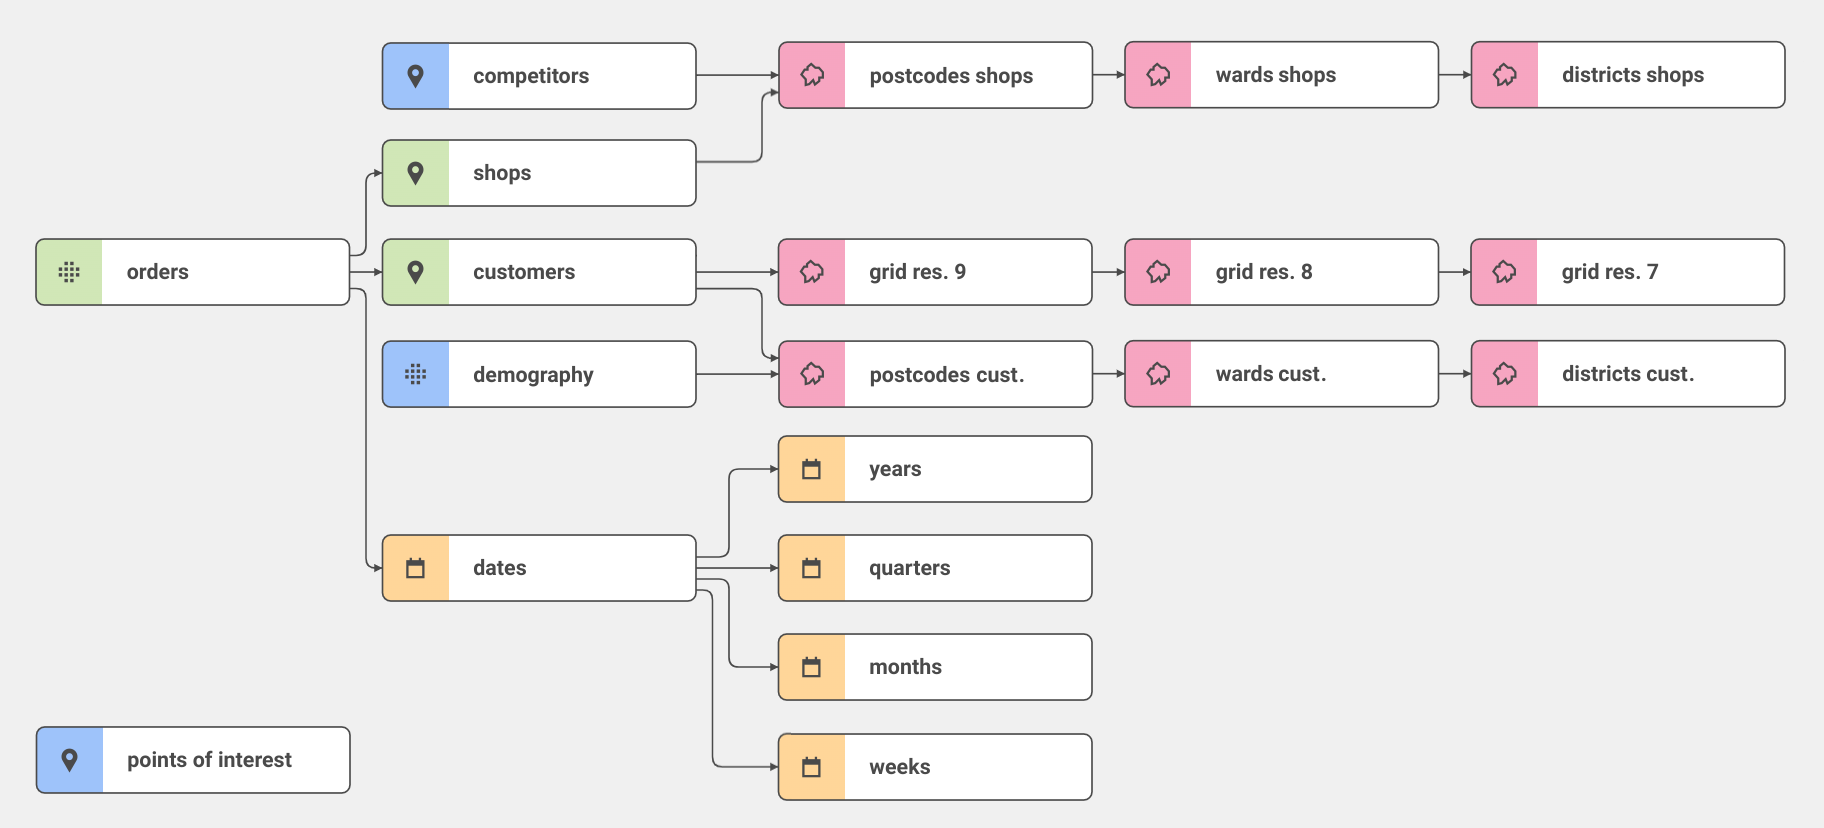
(internal fact tables green, external fact tables blue, date dimension yellow, space dimensions pink)
It is worth noting that some users prefer the flat tables approach (traditionally used in GIS) primarily because of its simplicity and ease of use. Even though it is true that using a flat table is faster for simple tasks, for analysing more complex data, it is more beneficial to spend time developing a multidimensional data model.
Key advantages of the multidimensional data model:
-
Simplified Data Analysis: The multidimensional data model facilitates easy data analysis from various perspectives and dimensions. Users can quickly retrieve, aggregate, and filter data based on dimensions such as time, location, product, or other relevant attributes. This allows you to make real ad-hoc analytics and slice and dice data.
-
Enhanced Clarity and Understandability: This model is intuitive and easily understandable for users. It helps create clear and structured data visualisations that support decision-making based on analysis. The model eliminates data duplication and simplified data update and ETL process.
-
Improved Data Integrity: Multidimensional data models provide mechanisms to maintain data integrity. Using hierarchies and relationships between dimensions makes it easier to enforce data consistency and accuracy across the dataset.
-
Easy extensibility: multidimensional data models allow easy extensibility of data structures. Users can easily add new dimensions, attributes or metrics to existing data cubes without significant changes to the data model. This provides flexibility to adapt to new data requirements and analytical processes.
Metric as a key to ad-hoc analytics
The next step for analysing data is to define a Metric. The metric is essentially a mathematical formula that defines how to aggregate the data. The reason why we define metrics separately is reusability.
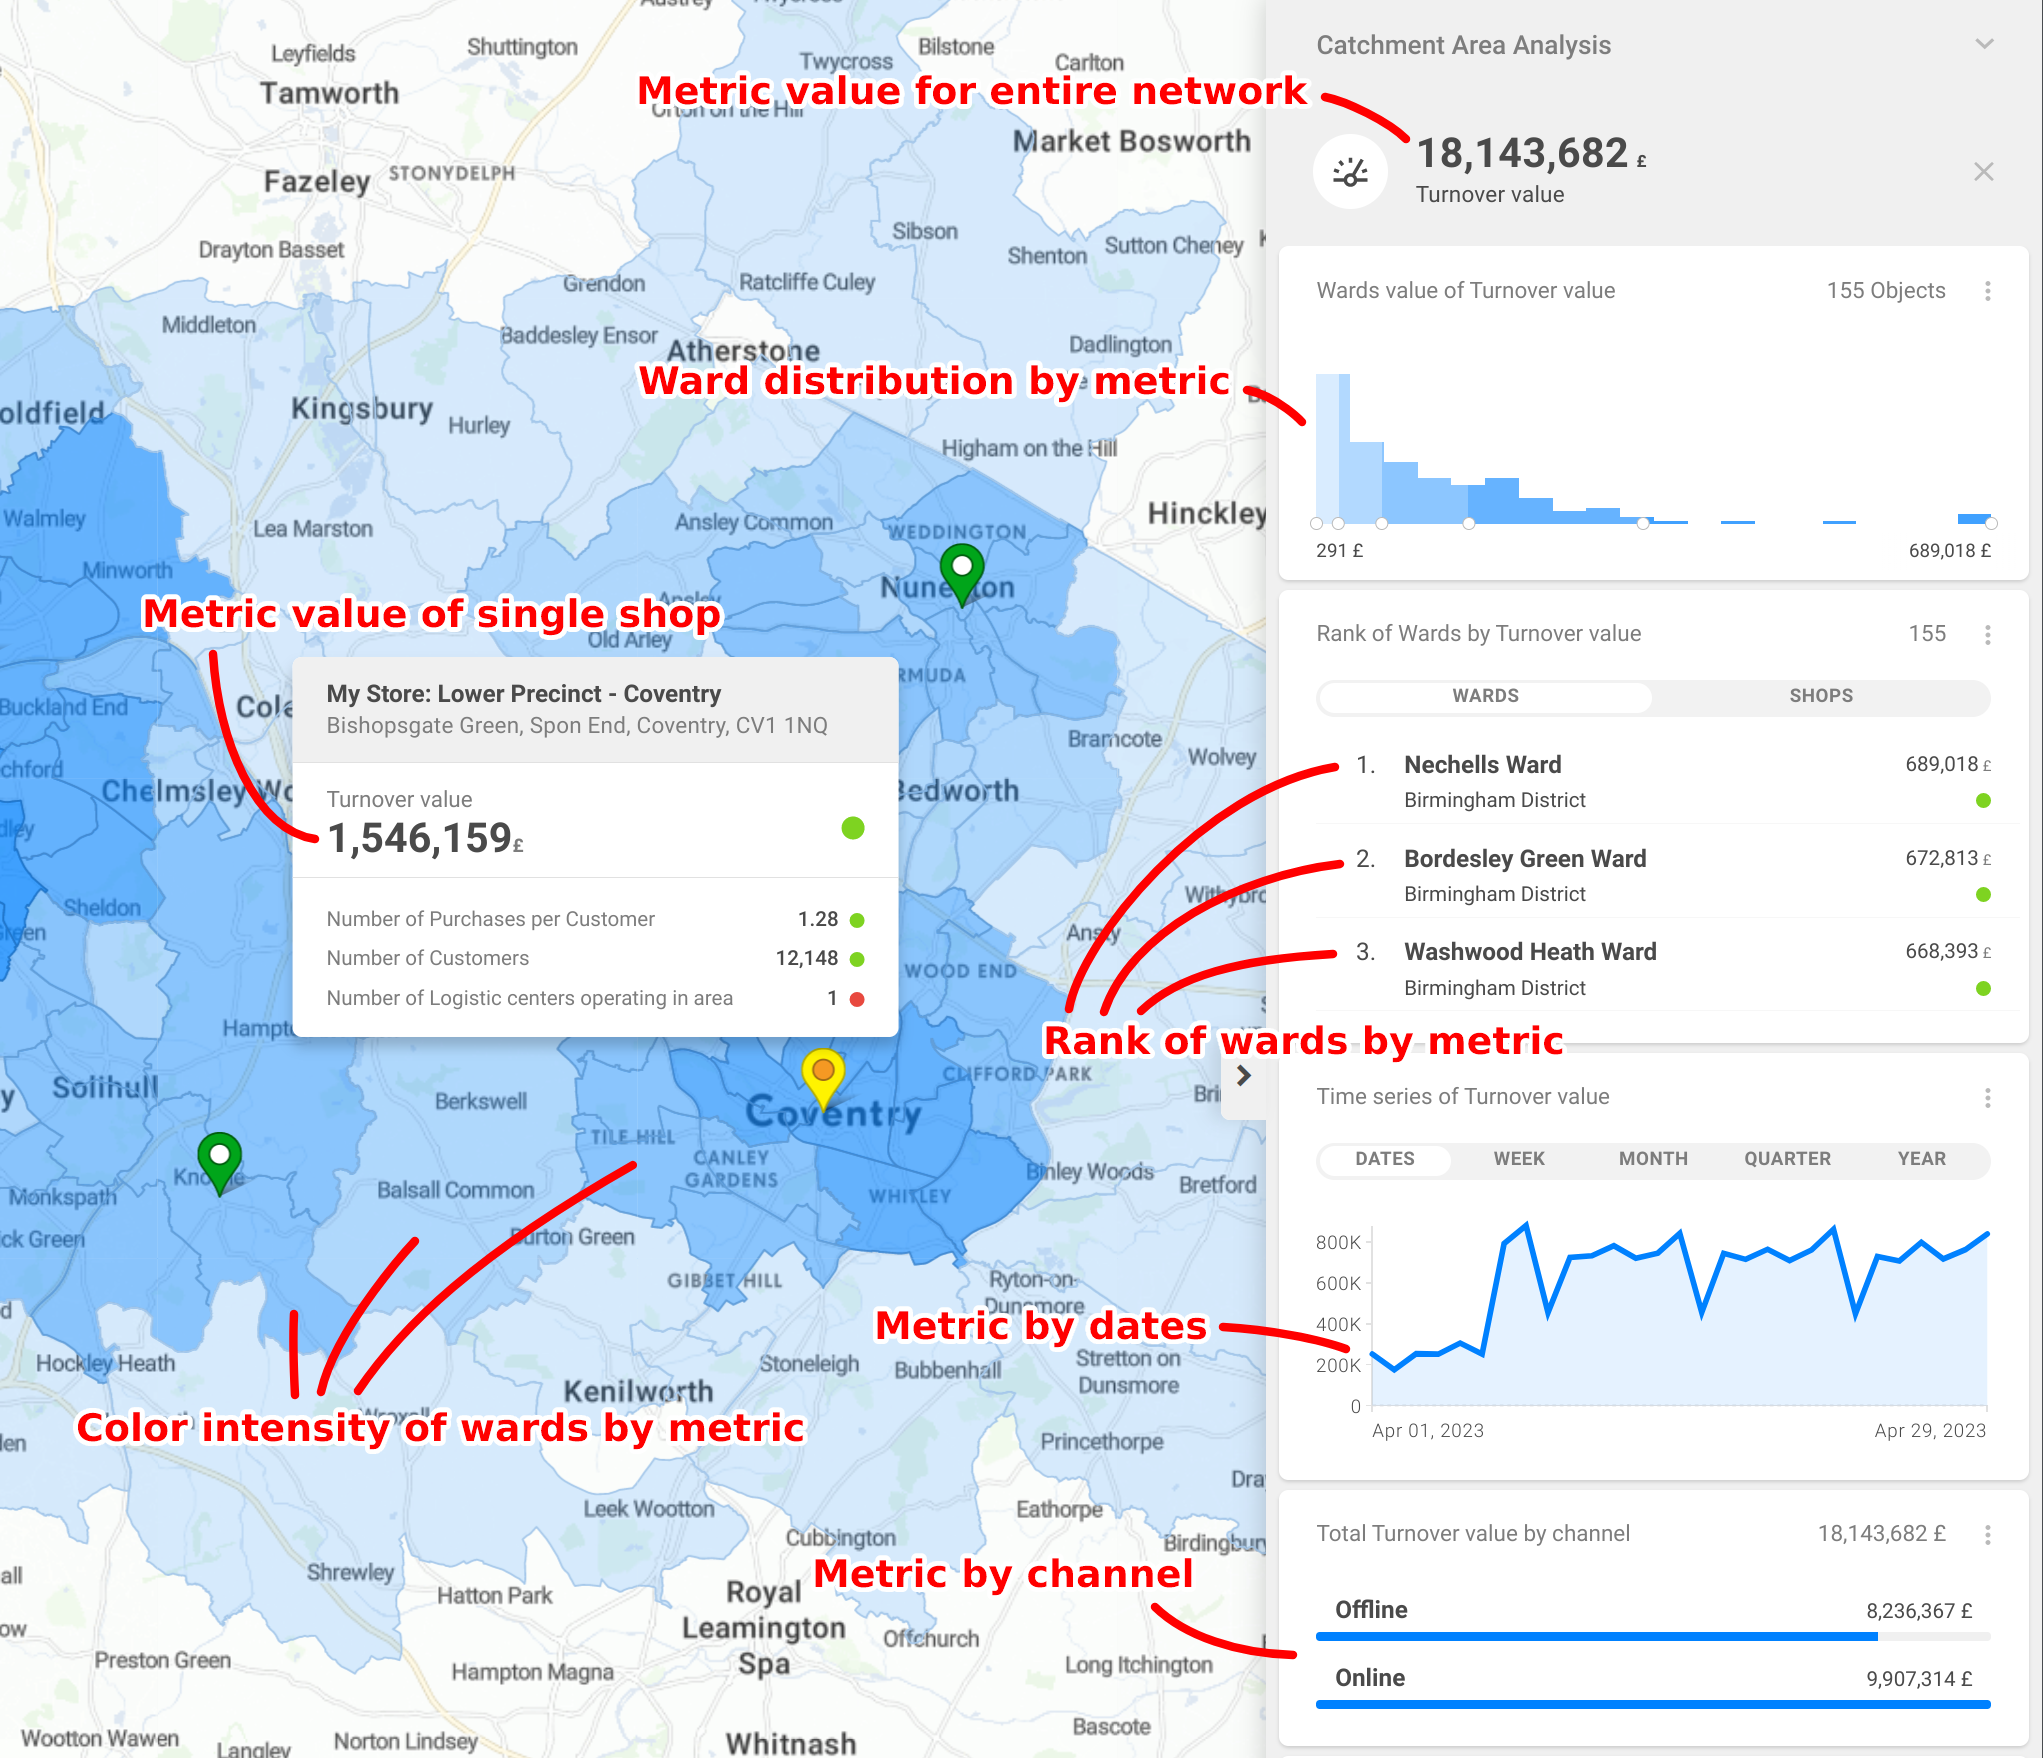
One metric definition can be used in different contexts and allows to:
-
view overall metric value (indicator on top of right panel)
-
show the phenomenon on the map (drill over any area - post-code, village, region)
-
compute metric histogram (metric occurrences)
-
rank areas by metric value
-
group the metric by any other attributes (online/offline purchases, delivery type, customer segment ..)
-
time trend (metric over time)
The following screenshot demonstrates how CleverMaps Studio reuses metric Turnover value in a different context. Let us emphasise that only one metric definition is needed to create the following map dashboard.
CleverMaps metrics are written in a custom query language, which is fairly simple and doesn't require users to know SQL. The use of logical writing of metrics allows to achieve high reusability of metrics, which would not be possible with direct SQL writing.
Reusability of metrics
Metrics can be used as stand-alone or as part of another metric. Existing metrics are monospace:
-
market share =
turnover/potential -
turnover in 2022 =
turnoverwhere dim_date.year = 2022 -
y/y turnover =
turnover in 2022-turnover in 2021
The metric can include basic fact and attributes filters (e.g. turnover in 2022), but the metric itself can serve as an advanced filter type:
-
population in my top ward areas - calculates the number of residents, but only in areas where
turnovercomputed by ward is greater than $10000. See syntax details here. -
y/y turnover in areas where
campaign cost> 30000
The power of CleverMaps Semantic Layer is that such metrics can be computed ad-hoc without the need to calculate data for planned use cases. Thanks to that, we provide the analysts with a strong tool for analytics and reporting without the need to constantly return and change the model according to the needs of individual analyses.
Reports
Prepared data model and defined metrics are the prerequisites for calculating a report. The report definition specifies a set of metrics, dimensionalities and filters.
For example, in the screenshot of CleverMaps above, there is a widget showing Residents by age. This report contains one metric residents, and that metric was grouped by attribute age. It should be emphasised that the report definition tells you what you want to calculate, not how it will be calculated.
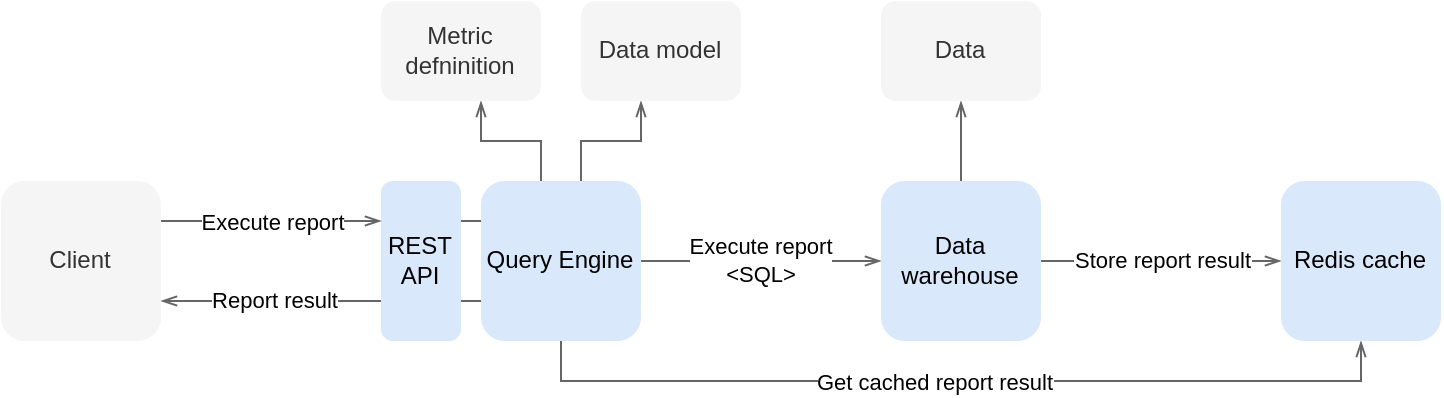
Report execution plan
The execution plan is prepared by CleverMaps Query Engine. The Query Engine processes the report definition and generates a SQL statement for the existing multidimensional model. Our example with residents by age is easy because there is just one dataset, but the Query Engine can find the optimal path how to join datasets, compute metrics with nested aggregation functions, filter reports by multiple metrics filters and much more. See the section below to find more details about CleverMaps Query Engine.
Report execution
Once the Query Engine prepares an optimal SQL execution plan, the computation on the Data warehouse (DWH) database can be started. It's the most resource-expensive task and the well-designed data model, together with an optimal report execution plan, is crucial to get results with latency in the lower units of seconds. Low latency is important for user experience which allows to make real ad-hoc analytics in CleverMaps Studio.
CleverMaps offers several configurations of a data warehouse:
-
shared DWH - a standard multitenant DWH deployed as a database cluster with multiple read replicas. Performance is shared among customers.
-
pro DWH - multitenant DWH with a doubled count of CPU and memory and fast SSD storage. This DWH is suitable for bigger projects with > 20 GB of data. Performance is shared among customers.
-
dedicated DWH - dedicated DWH for one customer. The performance of DWH is dedicated and is not shared with other tenants. CPU and memory can be scaled for customer needs.
-
on-premise DWH - hybrid cloud solution, DWH cluster is hosted on customer infrastructure and connected to CleverMaps AWS environment through VPN. This setup is suitable for enterprise customers with strict security policies and/or customers building a central DWH for multiple analytical tools (e.g. BI tools).
Once computed, the results of the computed report are stored in an in-memory database. Firstly, it allows us to reuse already computed reports. Secondly, we can quickly deliver data to the browser without pre-fetching all data (e.g. lazy loading of data to popups).
Query engine optimisation
As was mentioned before, the performance meters and CleverMaps Query engine does the hard work of SQL optimisation and allows you to focus on data and business problems. This is a brief list of optimisations:
-
join path - dynamically calculated the join path of required datasets for report execution
-
reused subqueries - in attribute filters are extracted as CTEs and reused among metrics
-
cached CTE - CTE statements are materialised as views and reused among queries and users
-
metrics grouping - multiple aggregations are merged into one SQL select statement
-
subqueries reduction - query engine detects useless subqueries (not contain any filter or having a condition) and skips it
-
filters injection - filters are injected into subqueries from top-level queries. The benefit is aggressively filtering the amount of joined data.
-
filters pushdown - filters on primary keys are pushed to the related dataset, eliminating unnecessary joins.
REST API and Semantic layer integration
We are developing our Semantic layer with an API-First approach. It means that features are available through a well-documented API that is developed with a backwards-compatible approach so as not to break any existing client APIs.
The REST API documentation is published on https://secure.clevermaps.io/doc/. You can download the OpenAPI specification for your tools. We maintain the Low level Python SDK for use as a dependency in Python projects. Java, JavaScript, TypeScript, and other SDKs can be generated from the OpenAPI specification using OpenApi Generator.
We design the semantic layer as an open data component that should be tightly integrated into your data stack exactly how you want it. Whether you plan to regularly update the data in CleverMaps datasets from your data lake, want to create a custom simple JavaScript application that executes a report in CleverMaps or want bulk export granular data, you can solve all of these requirements by integrating with CleverMaps REST API.
But the possibilities that API-First brings are much broader. You don't have to have an existing CleverMaps project at the start of the integration, but you can build the whole project via API. What does this mean? Complete control over the creation of the data project, its changes and access control. These features allow you to build custom data apps on top of CleverMaps for hundreds and thousands of your customers.
This will allow you to provision new projects dynamically, update existing projects (data and metadata), and manage your customers' access.
For help creating data products, contact our sales team for details.
CleverMaps also supports the DataOps approach, where you can version all configuration metadata in the GIT system.