In this tutorial, we will add markers to the project.
This tutorial also covers the configuration of markers in marker selectors.
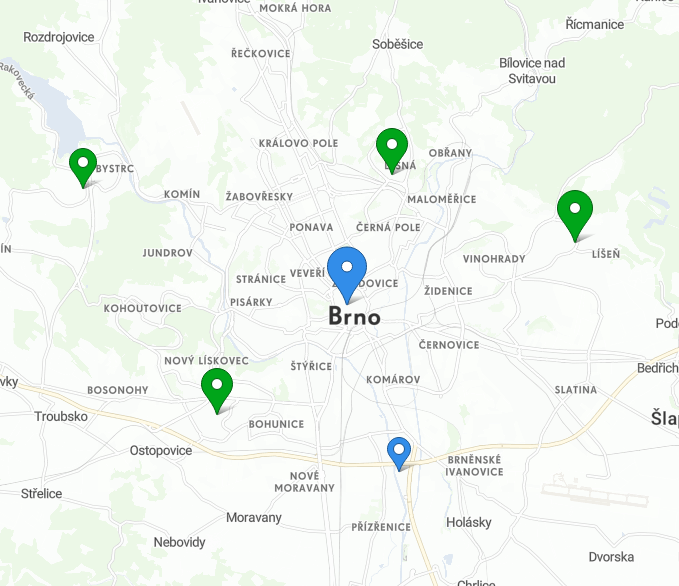
What you'll create
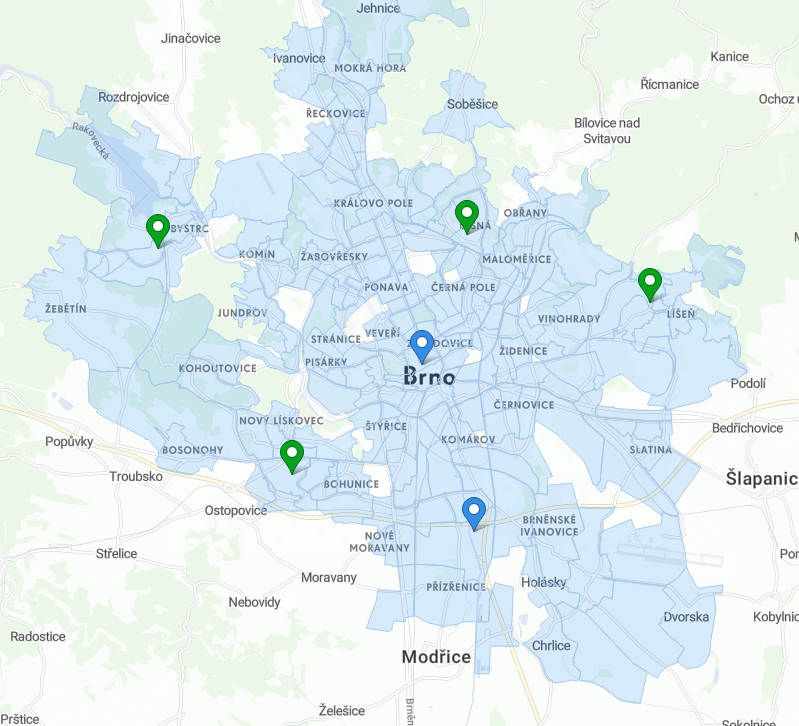
We will enhance the project with six markers, which represent two types of stores.
|
Store markers |
Store |
|
|
Stores dataset
We will add a new dataset to our project - stores. This dataset contains several stores where our customers performed the transactions. The stores can be of two types:
-
blue stores - main stores with big range of products
-
green stores - smaller stores with smaller range of products
|
Identifier |
Title |
Data type |
|---|---|---|
|
|
Store ID |
integer |
|
|
Store address |
string |
|
|
Store type |
string |
|
|
Opening hours |
string |
|
|
Monthly rent |
integer |
|
|
Contact email |
string |
|
|
Store web link |
string |
|
|
Designated parking lot |
string |
|
|
Number of employees |
integer |
|
|
Store's latitude |
latitude |
|
|
Store's longitude |
longitude |
The dataset can be downloaded here: stores.csv
Syntax of the dataset is similar to the clients dataset. But there is some new syntax in properties:
-
there's a
concatfunction infeatureTitle, which allows us to use and concatenate string with dataset properties in the tooltip -
there's a
featureAttributesarray, which defines attributes of the dataset's features which will be shown on when you click on a shop-
they have a primary/secondary
layout -
they can be formatted as a
number, or a clickableemailandlink
-
Stores dataset syntax
{
    "name": "stores",
    "type": "dataset",
    "title": "Stores",
    "description": "All blue and green stores.",
    "properties": {
        "featureTitle": {
            "type": "function",
            "value": "concat",
            "content": [
                {
                    "type": "text",
                    "value": "Store n."
                },
                {
                    "type": "property",
                    "value": "store_id"
                }
            ]
        },
        "featureSubtitle": {
            "type": "property",
            "value": "address"
        },
        "featureAttributes": [
            {
                "type": "property",
                "value": "opening_hours",
                "layout": "primary"
            },
            {
                "type": "property",
                "value": "monthly_rent",
                "format": {
                    "type": "number",
                    "fraction": 0,
                    "symbol": "CZK"
                },
                "layout": "primary"
            },
            {
                "type": "property",
                "value": "parking",
                "layout": "secondary"
            },
            {
                "type": "property",
                "value": "employees",
                "layout": "secondary"
            },
            {
                "type": "property",
                "value": "contact",
                "format": {
                    "type": "email"
                },
                "layout": "secondary"
            },
            {
                "type": "property",
                "value": "link",
                "format": {
                    "type": "link"
                },
                "layout": "secondary"
            }
        ]
    },
    "ref": {
        "type": "dwh",
        "subtype": "geometryPoint",
        "primaryKey": "store_id",
        "categorizable": true,
        "fullTextIndex": true,
        "properties": [
            {
                "name": "store_id",
                "title": "Store ID",
                "column": "store_id",
                "type": "integer",
                "filterable": false
            },
            {
                "name": "address",
                "title": "Store address",
                "column": "address",
                "type": "string",
                "filterable": false
            },
            {
                "name": "store_type",
                "title": "Store type",
                "column": "store_type",
                "type": "string",
                "filterable": true
            },
            {
                "name": "opening_hours",
                "title": "Opening hours",
                "column": "opening_hours",
                "type": "string",
                "filterable": true
            },
            {
                "name": "monthly_rent",
                "title": "Monthly rent",
                "column": "monthly_rent",
                "type": "integer",
                "filterable": true
            },
            {
                "name": "contact",
                "title": "Contact email",
                "column": "contact",
                "type": "string",
                "filterable": false
            },
            {
                "name": "link",
                "title": "Store web link",
                "column": "link",
                "type": "string",
                "filterable": false
            },
            {
                "name": "parking",
                "title": "Designated parking lot",
                "column": "parking",
                "type": "string",
                "filterable": true
            },
            {
                "name": "employees",
                "title": "Number of employees",
                "column": "employees",
                "type": "integer",
                "filterable": true
            },
            {
                "name": "lat",
                "title": "Store's latitude",
                "column": "lat",
                "type": "latitude",
                "filterable": false
            },
            {
                "name": "lng",
                "title": "Store's longitude",
                "column": "lng",
                "type": "longitude",
                "filterable": false
            }
        ]
    }
}
Defining markers
Now, we will define the markers that will represent the two store types.
Its style will be marker-blue and we will filter it by the store_type property of the stores dataset. We will link it to this dataset in the respective marker selector later. If the property value equals to "Blue", the marker will be blue.
Blue marker syntax
{
    "name": "blue_marker",
    "type": "marker",
    "title": "Blue stores",
    "content": {
        "style": "marker-blue",
        "propertyFilters": [
            {
                "propertyName": "store_type",
                "value": "Blue",
                "operator": "eq"
            }
        ]
    }
}
Analogously, define the green_marker. You can use copyMetadata to create a copy of the blue_marker and edit only the keys you need to edit.
Green marker syntax
{
    "name": "green_marker",
    "type": "marker",
    "title": "Green stores",
    "content": {
        "style": "marker-green",
        "propertyFilters": [
            {
                "propertyName": "store_type",
                "value": "Green",
                "operator": "eq"
            }
        ]
    }
}
Defining a marker selector
Our marker selector will refer to the stores dataset. We will add blue_marker and green_marker to its content, and add it to the project.
Stores marker selector syntax
{
    "name": "stores_marker_selector",
    "type": "markerSelector",
    "content": {
        "categories": [
            {
                "dataset": "/rest/projects/$projectId/md/datasets?name=stores",
                "markers": [
                    {
                        "marker": "/rest/projects/$projectId/md/markers?name=blue_marker",
                        "visible": true
                    },
                    {
                        "marker": "/rest/projects/$projectId/md/markers?name=green_marker",
                        "visible": true
                    }
                ]
            }
        ]
    }
}
Also, don't forget to add the markerSelector reference to the transactions_view's content, and upload it using pushProject.
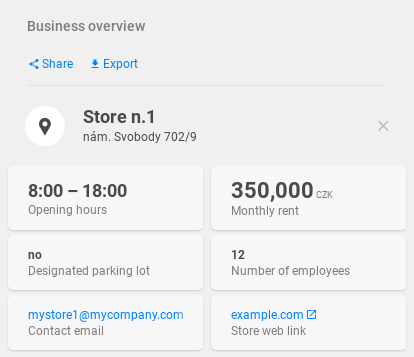
Business overview view excerpt
    ...
"content": {
    "icon": "shopping_cart",
    "dashboard": "/rest/projects/$projectId/md/dashboards?name=business_overview_dashboard",
    "markerSelector": "/rest/projects/$projectId/md/markerSelectors?name=stores_marker_selector",
    "defaultGranularity": "/rest/projects/$projectId/md/datasets?name=zsj_dwh",
    ...
Now, our markers should appear on the map. When you click on one, you can view its featureAttributes.
You can manage the objects by clicking on the Visibility tool icon (:visibility:) next to the Infopanel.
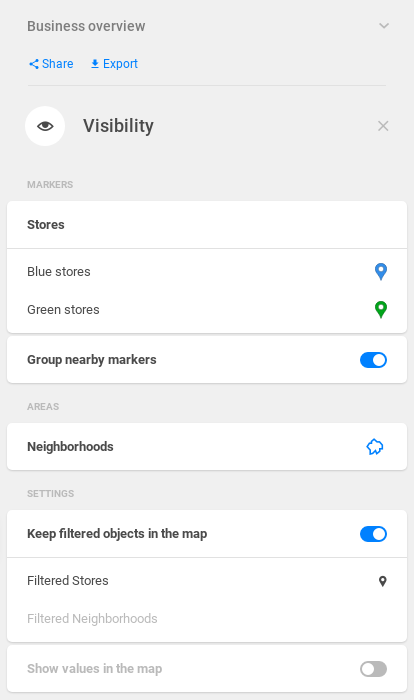
The Visibility tool also offers the option to turn off the Areas granularity.
Catchment areas
The addition of the stores dataset to our project gives us the ability to see the catchment areas of our stores.
We just have to link it to the transactions dataset. This dataset contains the store_id property, so we will add the foreignKey reference to the stores dataset.
Transactions date property
	    ...
    {
        "filterable": true,
        "name": "store_id",
        "title": "Store ID",
        "column": "store_id",
        "type": "integer",
        "foreignKey": "stores"
    },
	    ...
When Turnover value indicator is visualized, after clicking on a marker, catchment area of selected store will be displayed. Catchment areas represent those areas, where a given indicator has the biggest value.
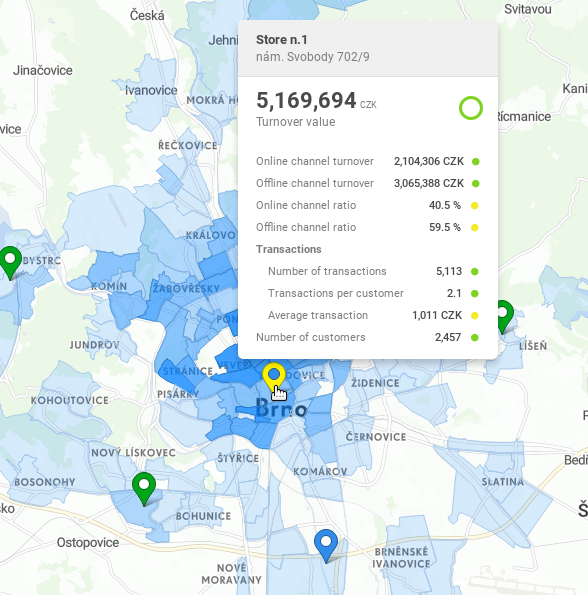
We can see that the city's main store - Store n.1 generates the biggest number of transactions in the centre of the city.
Markers offer various colors, shapes and styles. Make sure to check out the full palette in the Markers article.
Here are some examples: ![]()
![]()
![]()
![]()
![]()
![]()
![]()
![]()
Quantitative markers
It is possible to visualise the value of an indicator using quantitative markers of different sizes. We will add the markersOnly property to the business_overview_view content to achieve this.
Transactions view excerpt
    ...
"content": {
    "icon": "shopping_cart",
    "dashboard": "/rest/projects/$projectId/md/dashboards?name=business_overview_dashboard",
    "markerSelector": "/rest/projects/$projectId/md/markerSelectors?name=stores_marker_selector",
    "markersOnly": true
    ...
Use pushProject to upload the modified view.
Please note that this will exclude all other granuluaritites (administrative districts, customers) from the view.
After selecting an indicator, the marker sizes will change their sizes according to the value of that indicator.
That's it! In the next tutorial we'll learn how we can export data from CleverMaps.