We highly recomend to understand Main Concepts first. (3 min read)
Web application used to assemble and manage Map dashboards. Think of them as reusable group of interactive charts, values and map layers which visualizes given Metric. Values can be filtered, based on available attributes, metrics, polygons or distance. All values are computed ad-hoc on top of single Data model without need to use SQL. All together Studio allows to assemble data applications which can be directly shared or presented to managers to support their decision or is used to build Stories.
Introducing CleverMaps Studio
CleverMaps Studio (Studio) is a powerfull interactive tool designed for Business Intelligence, more specifically Location Intelligence, where you can explore your geospatial data on map dashboards. It's an ideal solution for analysts aiming to uncover patterns or anomalies in their spatial data, as well as project editors preparing data-driven presentations for clients or managers, which illustrate certain business phenomena. You can present your outputs directly in Studio, or in our Stories builder or as an embedded frame wherever you need.
With prepared multidimensional data model structure and calculated metrics stored in connected semantic layer, you are able to create customized map dashboards. Moreover, all metrics and visualizations are automatically recalculated to match your selected data perspectives and levels of granularity.
CleverMaps Studio is designed to transform complex data analysis into an intuitive and streamlined process, making it easier for you to focus on the insights that truly matter.
What is view
Lets look closer at our Studio and what you can do with it.
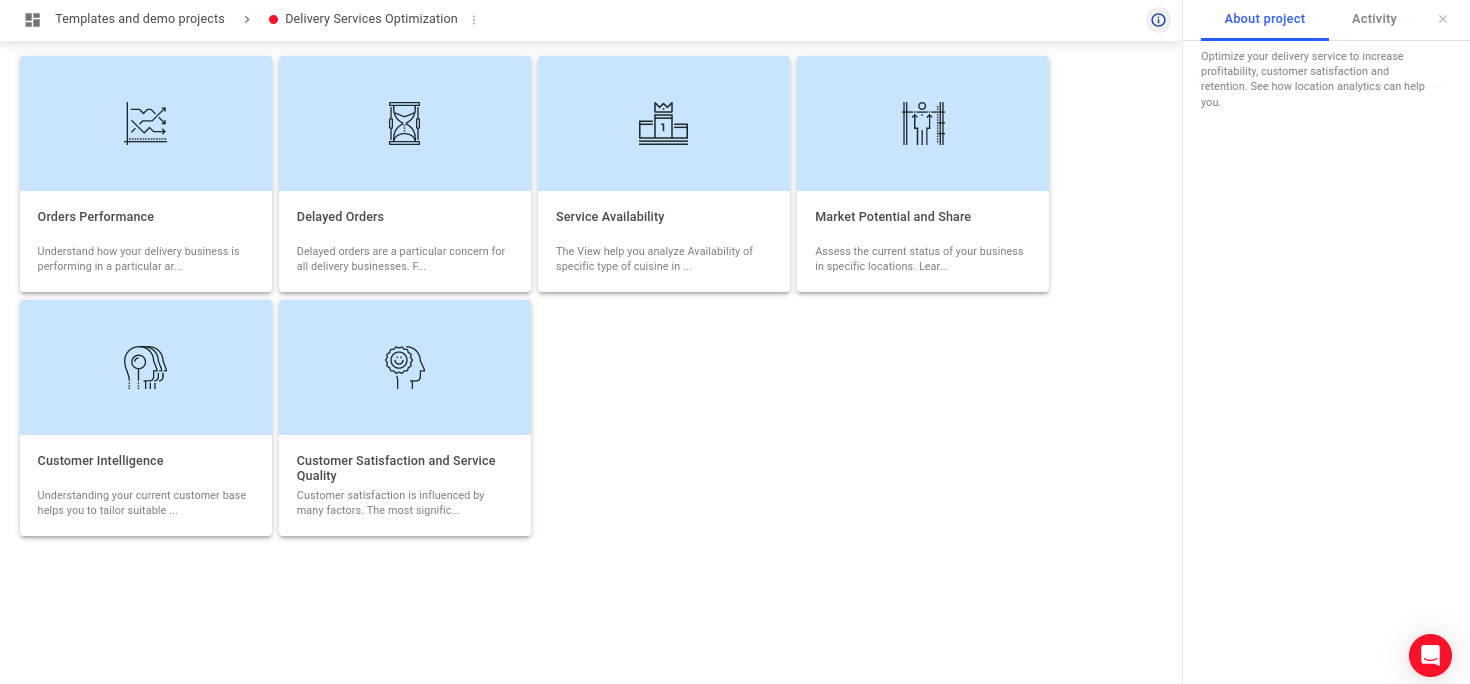
When you open the project page, you’ll see the list of map dashboards. In studio, we call them views. Each view enables you to explore your data from different perspective.
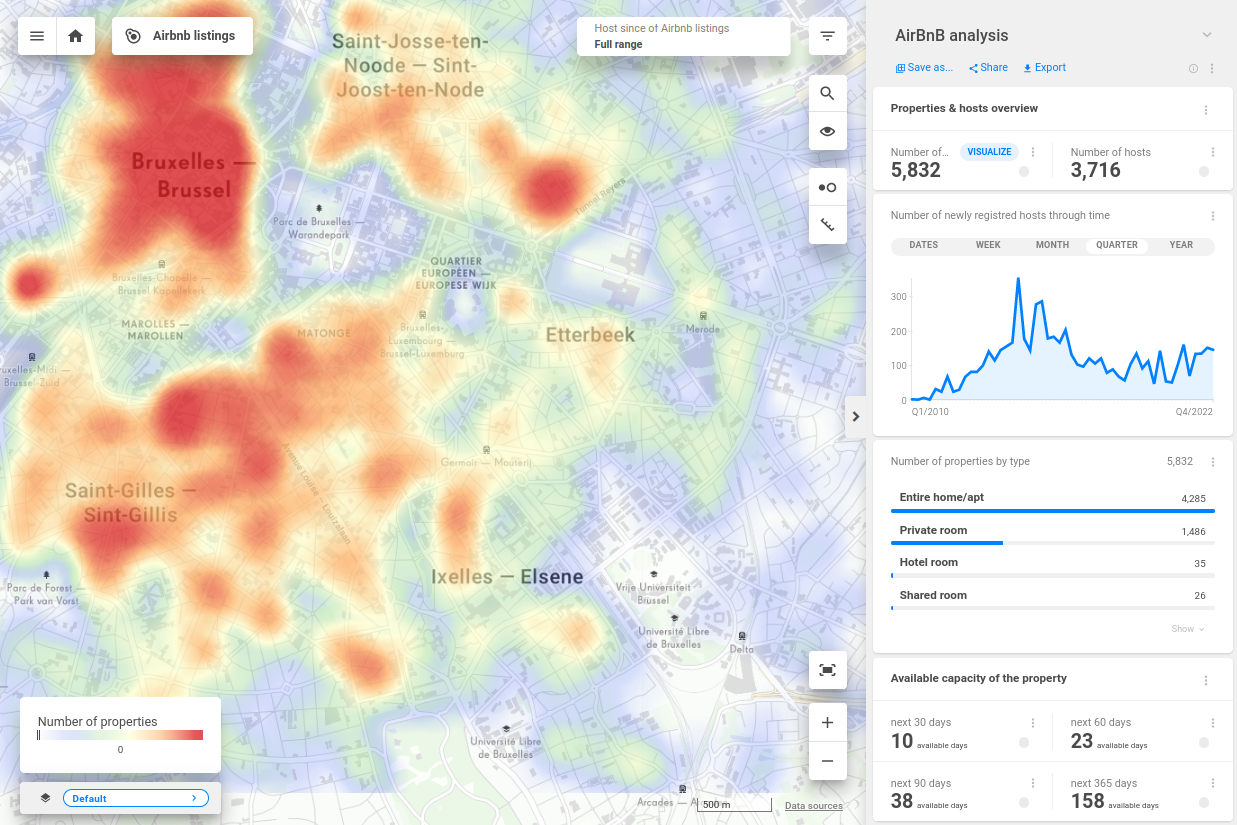
When you choose one of the views, you’ll be transfered to the view page with an interactive map dashboard, which consists of a map and a dashboard. And it offers a lot of ways to explore your data.
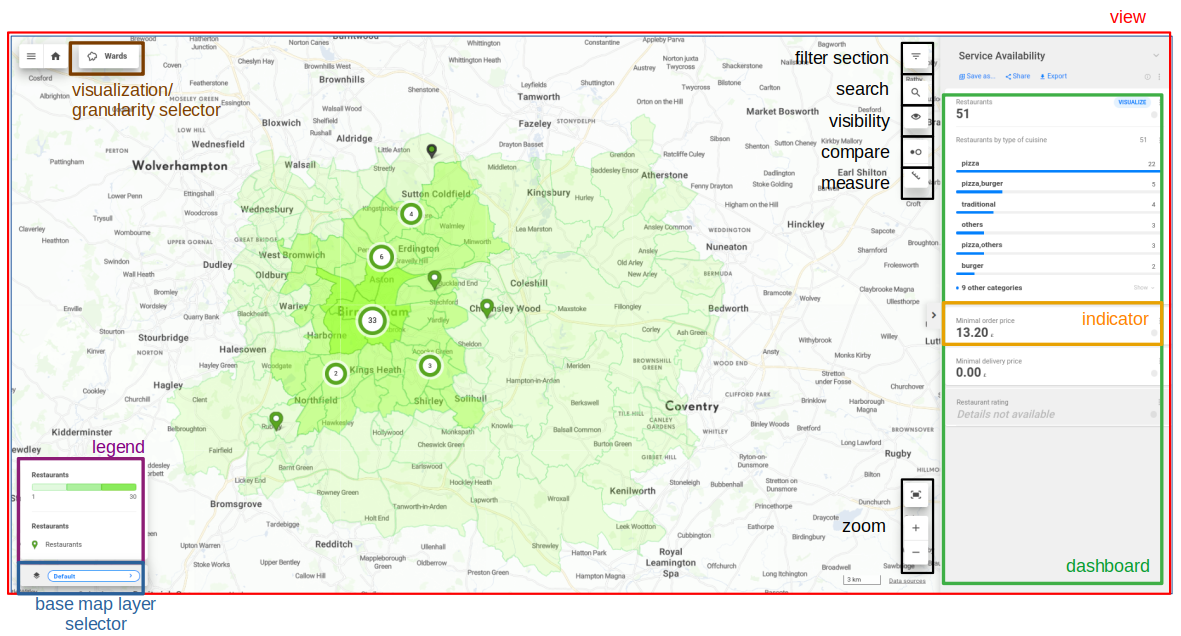
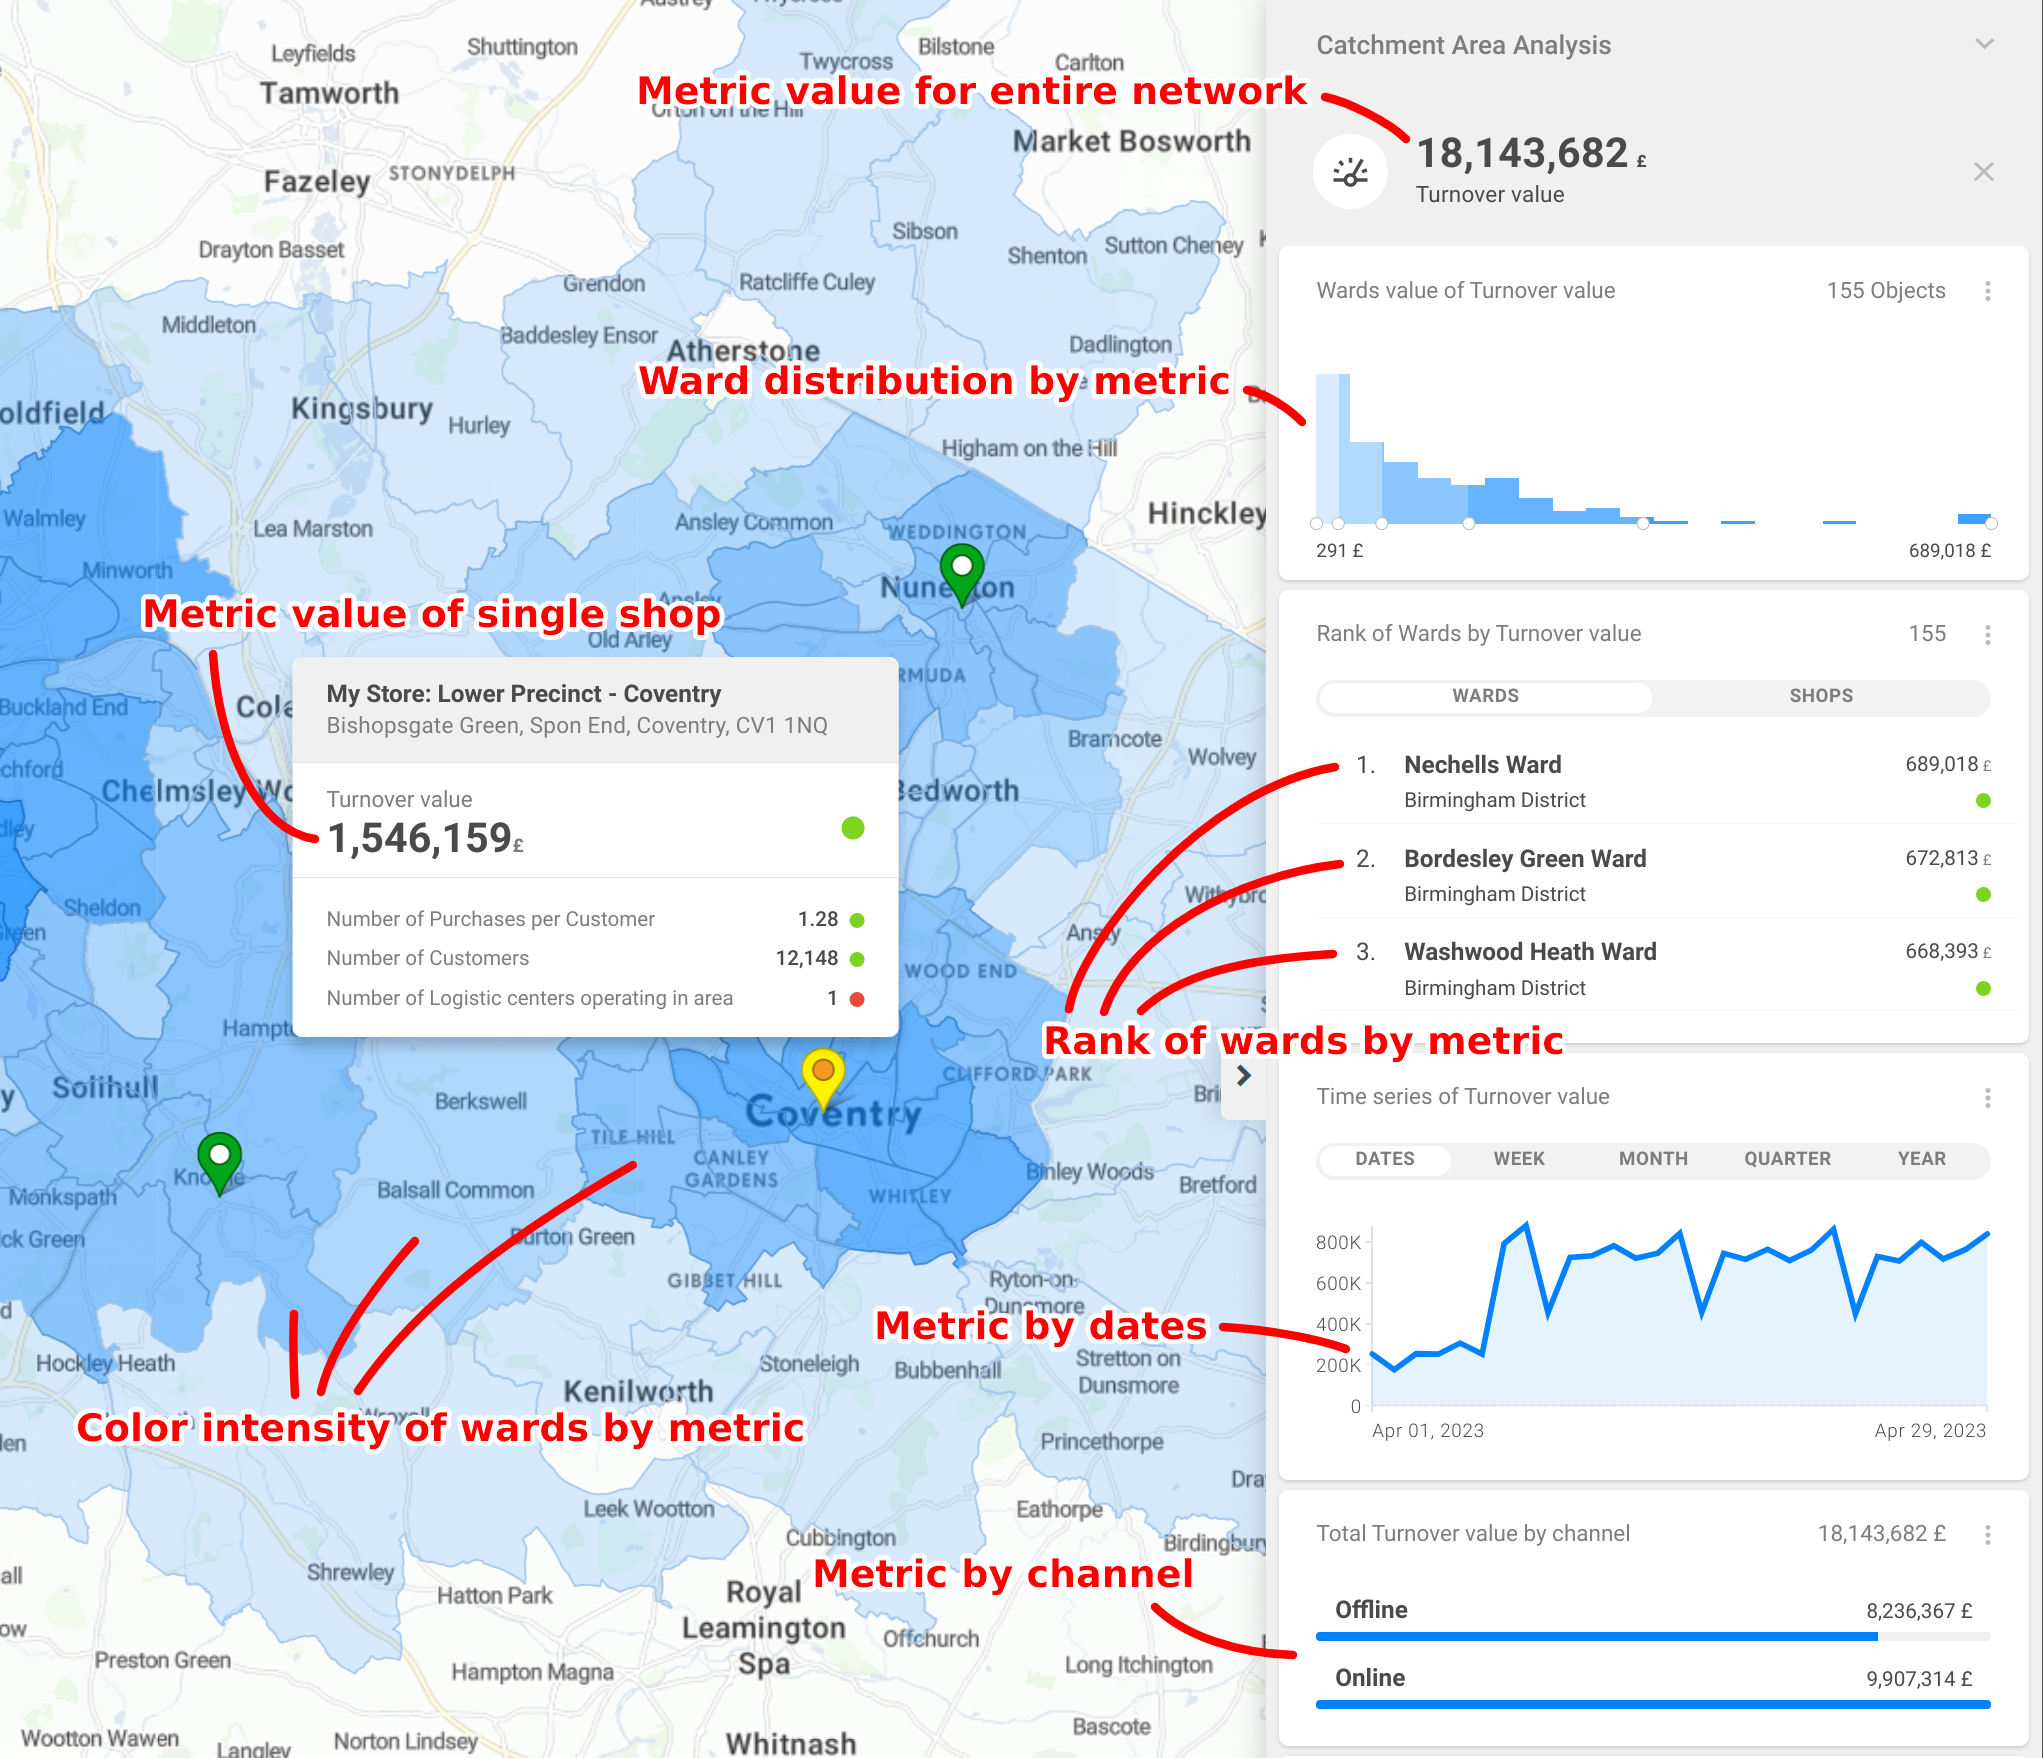
All metrics (their indicator representations) are being displayed on the map and dashboard in various contexts and interactively recalculated based on selected filters.
For a better understanding of its capabilities, we encourage you to explore the demo section, which presents many use cases.
Creating and editing views
In case your role is to administer existing projects with pre-established semantic layer with data model, the Studio is perfectly suited to your needs. You’ll be able to do create and manage your map dashboards (views), do basic editing, creating visualisations, or prepare your views for stories builder. Studio is under continuous development, constantly expanding its capabilities to include more features for direct view editing.
However, if your responsibilities include creating new projects or making changes to the data model - in general setting up a semantic layer - you’ll be using CleverMaps Shell as well.
CleverMaps Shell, a command line interface tool, is essential for creating semantic layer - managing the data and metadata of CleverMaps projects. But it can be used for changes in Studio too.
Metadata acts as a guide for displaying your data in CleverMaps. It defines which metrics will appear on the dashboard, what kind of visualizations will be used, how you can filter the data, or the structure of the data model. It essentially sets the rules for how your data will be presented. Most metadata settings are configured in the CleverMaps Shell (or GIT, or REST API,..) but some, especially those related to views, can be edited directly within the Studio and are therefore accessible in both the Studio and the Semantic layer. Each view (map dashboard) includes metadata objects like View, Dashboard, Indicator Drills, and MarkerSelector.
All CleverMaps metadata are expressed in JSON format. A key advantage of this format is its accessibility - JSON is easily readable for both humans and machines. While basic editing work in the Studio does not require a deep understanding of the metadata model and JSON, for more complex tasks or creating a project in CleverMaps Shell a basic knowledge of JSON is needed.
You can read more about our metadata model here https://docs.clevermaps.io/docs/metadata-model
You can find more information about CleverMaps Shell here: CleverMaps Shell
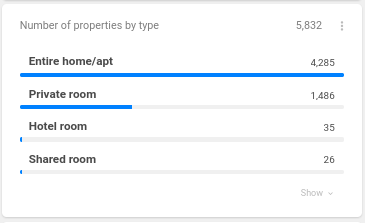
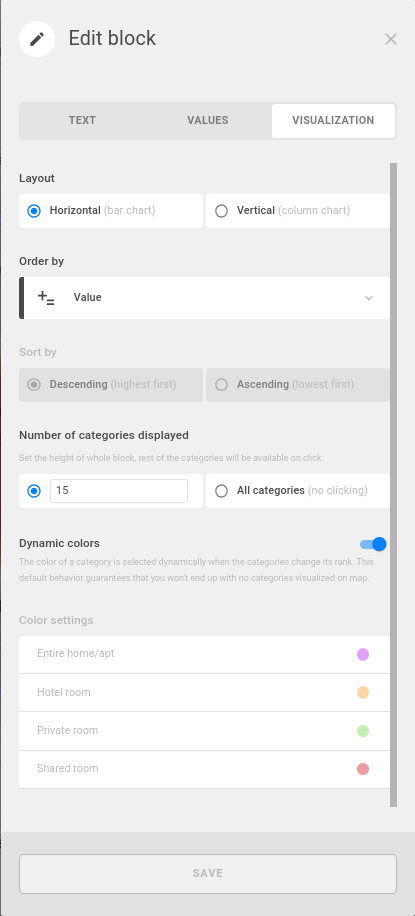
Example of editing categories in Shell and in Studio
		{
			"type": "categories",
			"title": "Number of properties by type",
			"description": "Number of properties by type",
			"splitProperty": "airbnb_listings.room_type",
			"indicator": "/rest/projects/i1p5cbij39498bh6/md/indicators?name=properties_count_indicator",
			"sizeLimit": 15,
			"vertical": false
		},
Functionalities of CM Studio vs Shell
|
|
CleverMaps Studio |
CleverMaps Shell |
|---|---|---|
|
Create project |
❌ |
✔️ |
|
Create/change data model |
❌ |
✔️ |
|
Create/edit views |
✔️* |
✔️ |
|
Edit dashboard |
✔️ |
✔️ |
|
Create new metric, indicator |
✔️* |
✔️ |
|
Edit visualisations of metrics (indicators) |
✔️ |
✔️ |
|
Create/edit indicator drills |
❌ |
✔️ |
|
Create and manage markers |
❌ |
✔️ |
|
Create/edit filters |
✔️ |
✔️ |
|
Upload data |
✔️ |
✔️ |
* create by cloning and then editing