Learn how to visualize your own data as a dot map and analyze them in a location context.
When to use our Customer Touchpoints KPI tracking
Customer Touchpoints KPI tracking is a ready-to-use solution to visualize spatial data and do basic location analysis. No need for installation, no need to learn GIS, no need to prepare a relational data model. You simply upload two datasets:
-
a dataset of your branches with location coordinates
-
a dataset with KPI values for each of your branches
and the rest of the hard work is done by our innovative computational engine packed in a template. In the end, you are presented with an interactive map interface where you naturally see insights of your data.
What data you need to start using the template
You can use the Customer Touchpoints KPI tracking with your branches and its KPIs. Your branches must have location coordinates. Mandatory columns of your csv files:
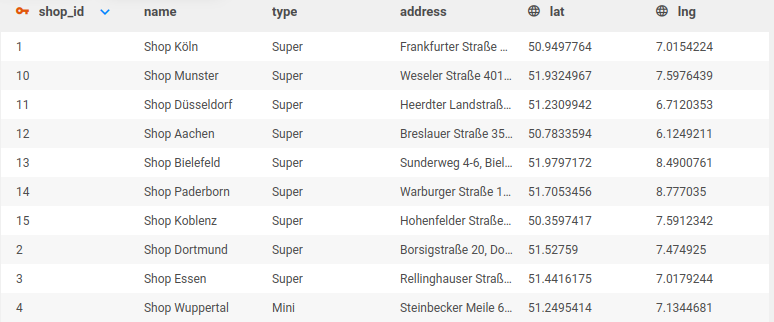
branches.csv table:
-
shop_id - unique ID of your branch
-
name - name of your branch
-
type - type of your branch e.g. type 1 / type 2 or wholesale / retail
-
address - any address
-
lat - latitude
-
lng - longitude
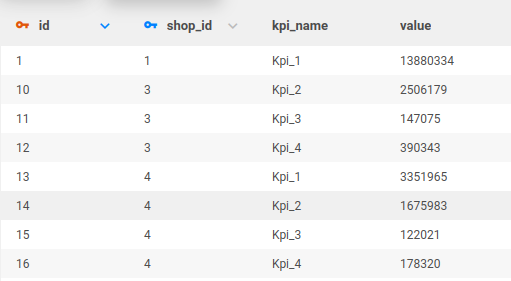
kpi_dwh.csv table:
-
id - unique row id
-
shop_id - ID of your branch
-
kpi_name - name of the desired one or more KPIs, e.g turnover, cost, rent… (there is no limit on the type)
-
value - numeric value of KPI
Both tables and all the columns mentioned above are mandatory for this template.
Why to use this template?
Valuable insights you can get from the spatial analysis:
-
Where are branches with the highest / the lowest turnover geographically concentrated?
-
Which branch has the highest potential to grow (the highest number of customer, but low turnover per customer)?
-
Which branches should be closed because there is no potential to grow (low number of customers, low turnover and a lots of branches in driving distance) ?
-
Where is a potential area to expand?
-
Do your stores cannibalize over each other?
-
How much of the turnover is made up of individual branches from the entire network ?
-
How high is turnover per customer?
-
How is Turnover per customer?
-
How is Cost / Income ratio ?
-
How many stores are within 15 minutes driving from your planned warehouse?
-
How high is turnover or number of customers in branches which are located in selected area in map?
Questions that such insight can help you to answer:
-
Complex overview of your network from many different perspectives in one dashboard
-
Which branches should be praised?
-
Which branches have big problems and should be closed?
-
Which branches have problems and need support?
-
All main analytics indicators in one application
How to start using the template with your data
The system is designed to be extremely easy. We want you to get your answers as fast as possible.
Step 1: Log in or Sign up
In the following tutorial, we expect you’ve already registered and logged in into CleverMaps. If not, please follow our Become user tutorial.
Step 2: Use the Branches solution with KPIs
Go to https://secure.clevermaps.io/#/projectList/templates and select the Customer Touchpoints KPI tracking template. Click on Use with my data button. In the following dialogue fill up the new project name.
Step 3: Prepare your data
The template requires data in a CSV format. Both tables can be exported from any spreadsheet software (Google Sheets, Microsoft Excel, LibreOffice Calc, Numbers for macOS, ...) or a database. CSV must be comma-separated and follow a precise structure.
The branches.csv table must contain exactly 6 columns in the following order:
-
Shop ID - unique identifier of a branch. If your branches don't have a unique ID, you can use a row number.
-
Name - name of your branch. For example Branch 1 or Branch Wien or your own description
-
Type - type of your branches. Number of types could be various. For example type small / type medium or retail / wholesale
-
Address - address of your branch
-
lat - latitude - geographic coordinate value which represents a location of data. Typically it is obtained directly from a GPS device or derived from an address. Check a How to get coordinate values section below or read an article Latitude on Wikipedia for more details.
-
lng - longitude - geographic coordinate value which represents a location of data. Typically it is obtained directly from a GPS device or derived from an address. Check a How to get coordinate values section below or read an article Longitude on Wikipedia for more details.
The kpi_dwh.csv table must contain exactly 4 columns in the following order:
-
id - unique row id
-
shop_id - ID of your branch, this must match the shop_id column of the branches.csv table, because this column is a foreign key to it
-
kpi_name - name of the desired one or more KPIs, for example turnover, cost, rent… (there is no limit on the type), string
-
value - numeric value of KPI. For example 4525451.5
You can find more details in our article Data requirements for templates.
How to get coordinate values
Latitude and longitude values can be obtained directly from a GPS device or derived from real-world addresses. The derivation process is called Forward geocoding.
You can find a lot of tools to do the job. Use any you like. If your dataset contains up to thousands of rows you can find tools for free. We recommend:
-
Geocodeapi allows users to upload a CSV file with addresses and appends a new latitude and longitude columns to it.
-
OpenCage supports many ways to geocode. For example, direct plugins to Google Sheets and Microsoft Excel.
-
LocationIQ provides an HTTP endpoint which accepts geocode requests with an address and returns a response with coordinates.
-
If you have less than 1000 addresses to geocode, you can also use Google spread sheet plug-in Geocode by Awesome Table for free.
The sad reality is that automated geocoding is not errorless. Real-world addresses can be written in many formats in each country and computers have problems to understand them. For best result, manual address format unification precedes and manual error cleaning follows.
If you need to geocode larger datasets or have any problems with the process, please contact us through support@clevermaps.io, +420 608 726 006 or a web form.
Step 4: Load the data into a template
When you have a properly formatted CSV file and stored it on a local disk you are ready to load it to a Branches. Click on the Upload file button and select the CSV file or drag and drop it in a marked area. If the file is not in the correct format, the template tells you so you can fix it and try again. If the problem persists check our Data requirements for templates article.
You will be able to load the branches.csv immediately after creating your own project. In order to load, the kpi_dwh table, you must go to the data model, click on the table and use the load CSV button.
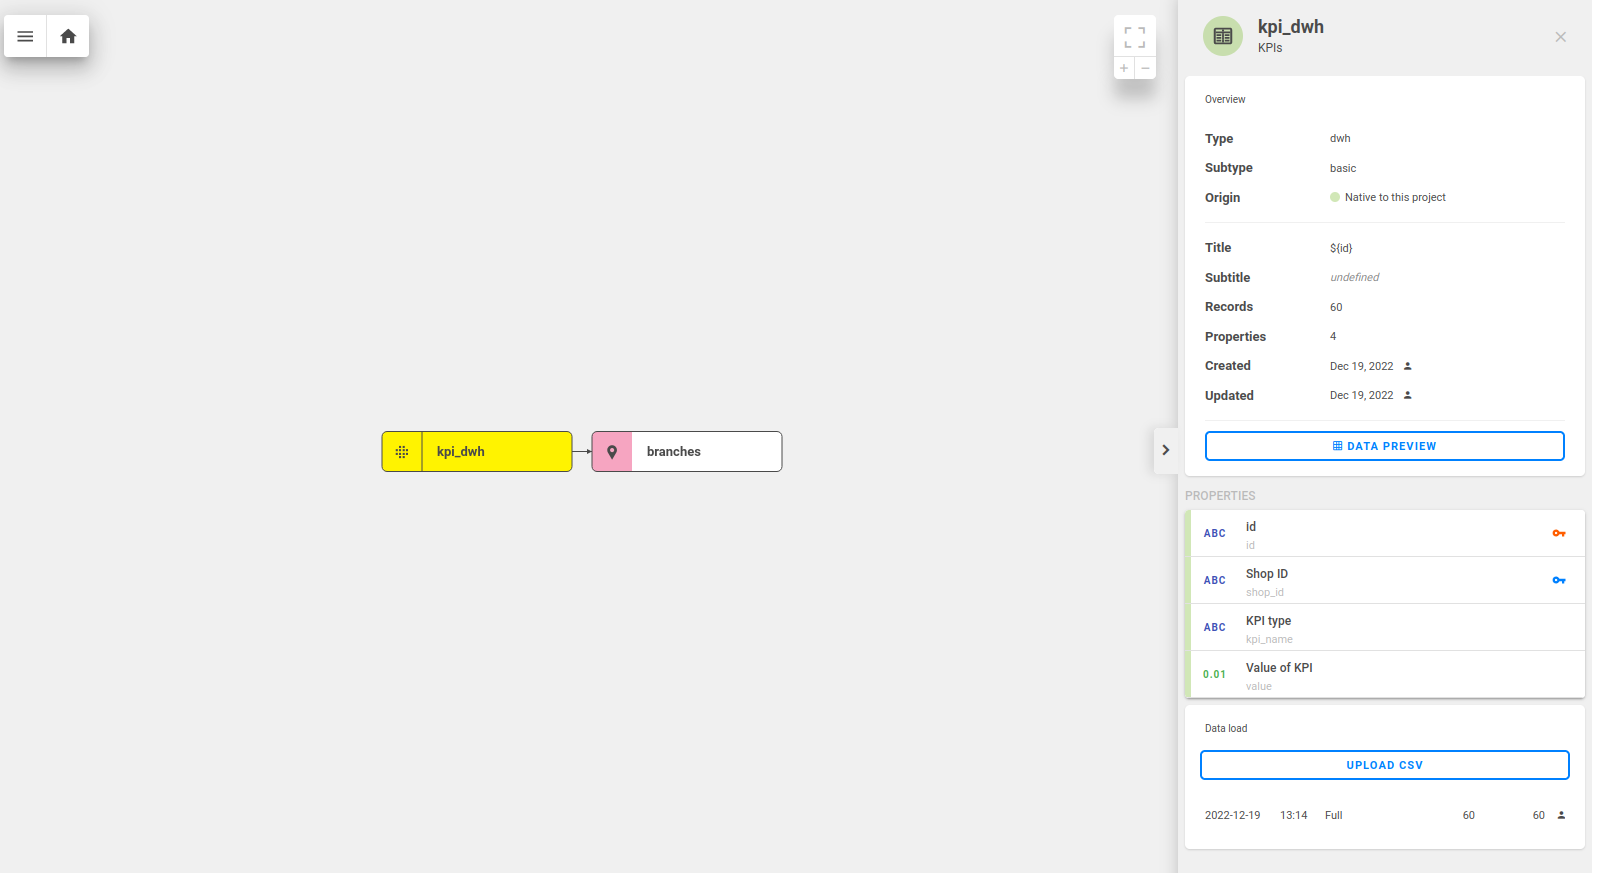
IMPORTANT: After you load your own data into kpi_dwh table, none of the metric will work at first. That is caused by incorrect values in the filterBy section. In the next step, we will explain how to properly set the metrics. You must replace the “Kpi_x” value by the correct atribut from your own data from the table.column -> kpi_dwh.kpi_name.
Step 5: Editing metrics
As mentioned above, after the data is loaded the metrics will not work at first and the results of all will be N/A. That is caused by incorrect values in the filterBy section. The filterBy section of each metric must be changed to the values that are included in your own data.
Your filterBy section will for example look like this, if one of your KPI names is “Turnover”:
{
				"filterBy": [
					{
						"property": "kpi_dwh.kpi_name",
						"value": "Turnover",
						"operator": "eq"
					}
				]
			}
In case you need an additional metric, you can add it by cloning one of those you already have on the dashboard. After a metric is cloned, the metric must be edited. That can be done by clicking on three dots and edit metric. All functions which can be used in CleverMaps can be found here.
For example this metric will compute a ratio between two different KPIs.
{
	"type": "function_divide",
	"content": [
		{
			"type": "function_sum",
			"content": [
				{
					"type": "property",
					"value": "kpi_dwh.value"
				}
			],
			"options": {
				"filterBy": [
					{
						"property": "kpi_dwh.kpi_name",
						"value": "Kpi_2",
						"operator": "eq"
					}
				]
			}
		},
		{
			"type": "function_sum",
			"content": [
				{
					"type": "property",
					"value": "kpi_dwh.value"
				}
			],
			"options": {
				"filterBy": [
					{
						"property": "kpi_dwh.kpi_name",
						"value": "Kpi_1",
						"operator": "eq"
					}
				]
			}
		}
	]
}
Step 6: Adjust indicators (optional)
After all metric are fixed, for better readability, you can change their name and description by renaming their indicators and add its unit to better reflect the values of your data. Simply open the indicator menu and click at the Edit indicator option.
The indicator has title and description based on metric because we would like to let you choose your own KPIs. So for example if your KPI 1 isn't Turnover but Number of employees , then rename it.
Step 7: Removing or adding indicators (optional)
This template is currently set by default for 4 KPIs, but your can have less or more of them.
Indicators (metrics), which are not needed on the dashboard can be removed through edit dashboard (three dots under the name of the view).
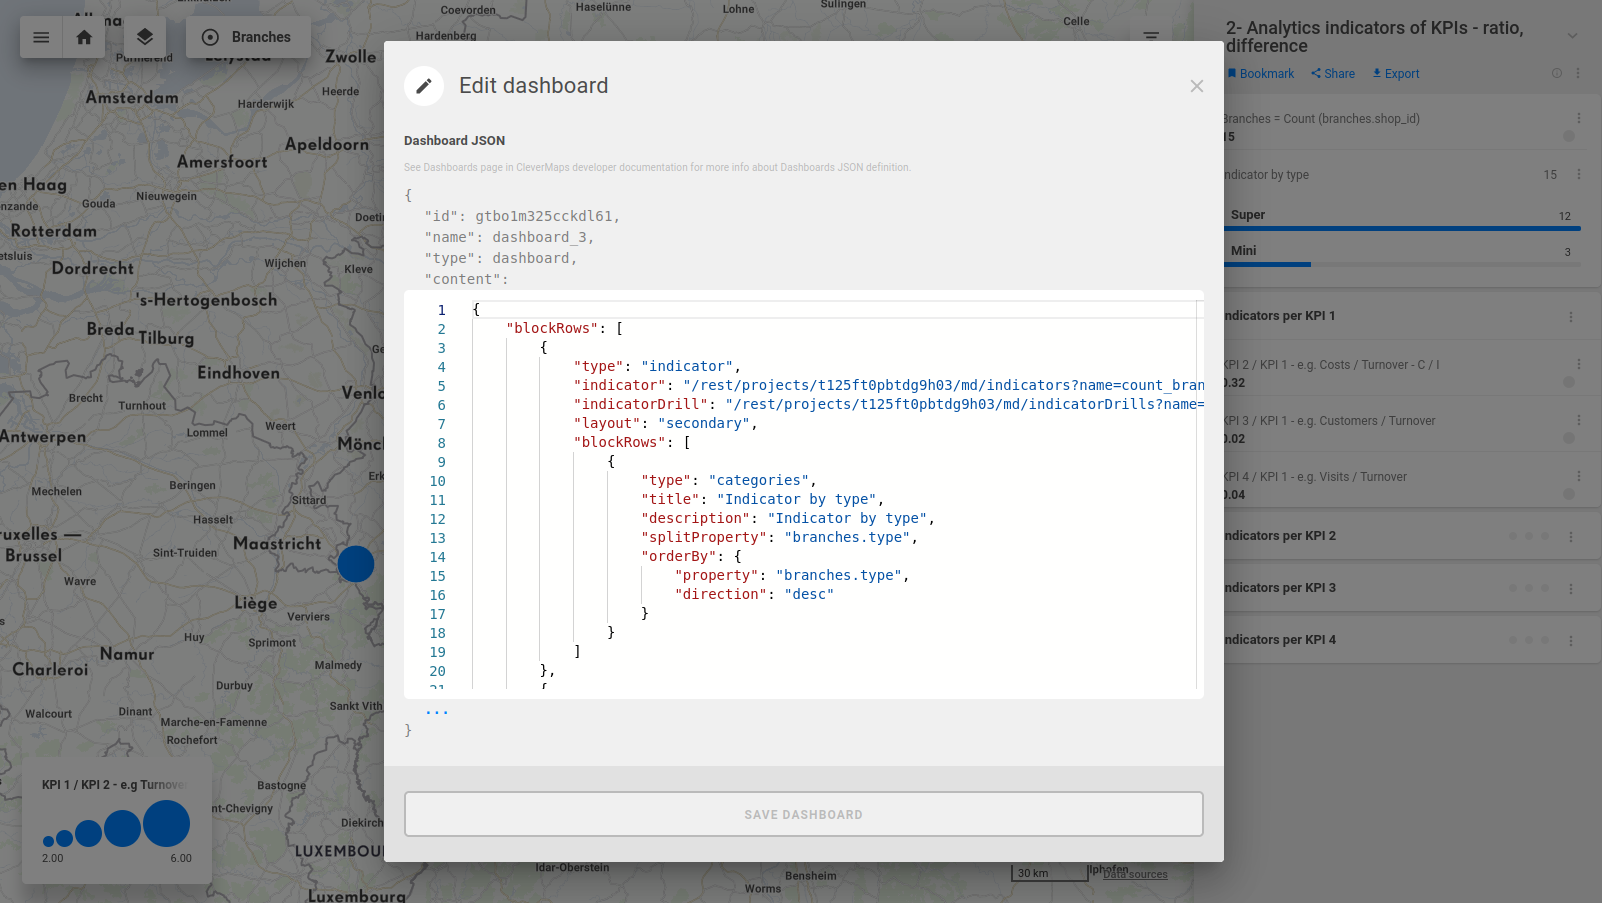
Indicator can be simply removed by deleting a blockRow object such as the one below.
{
  "type": "indicator",
  "indicator": "/rest/projects/t125ft0pbtdg9h03/md/indicators?name=ratio_kpi_2_kpi_1_indicator",
  "indicatorDrill": "/rest/projects/t125ft0pbtdg9h03/md/indicatorDrills?name=indicator_drill",
  "layout": "secondary"
}
You can also add a new metric, that can be done by cloning any existing metric by clicking on three dots on metric and clone button. After cloning, new metric will be created at the end of the dashboard. The position can be changed through edit dashboard.
Step 8: Adding filters (optional)
If you want to edit a view, you can do so from the project page.
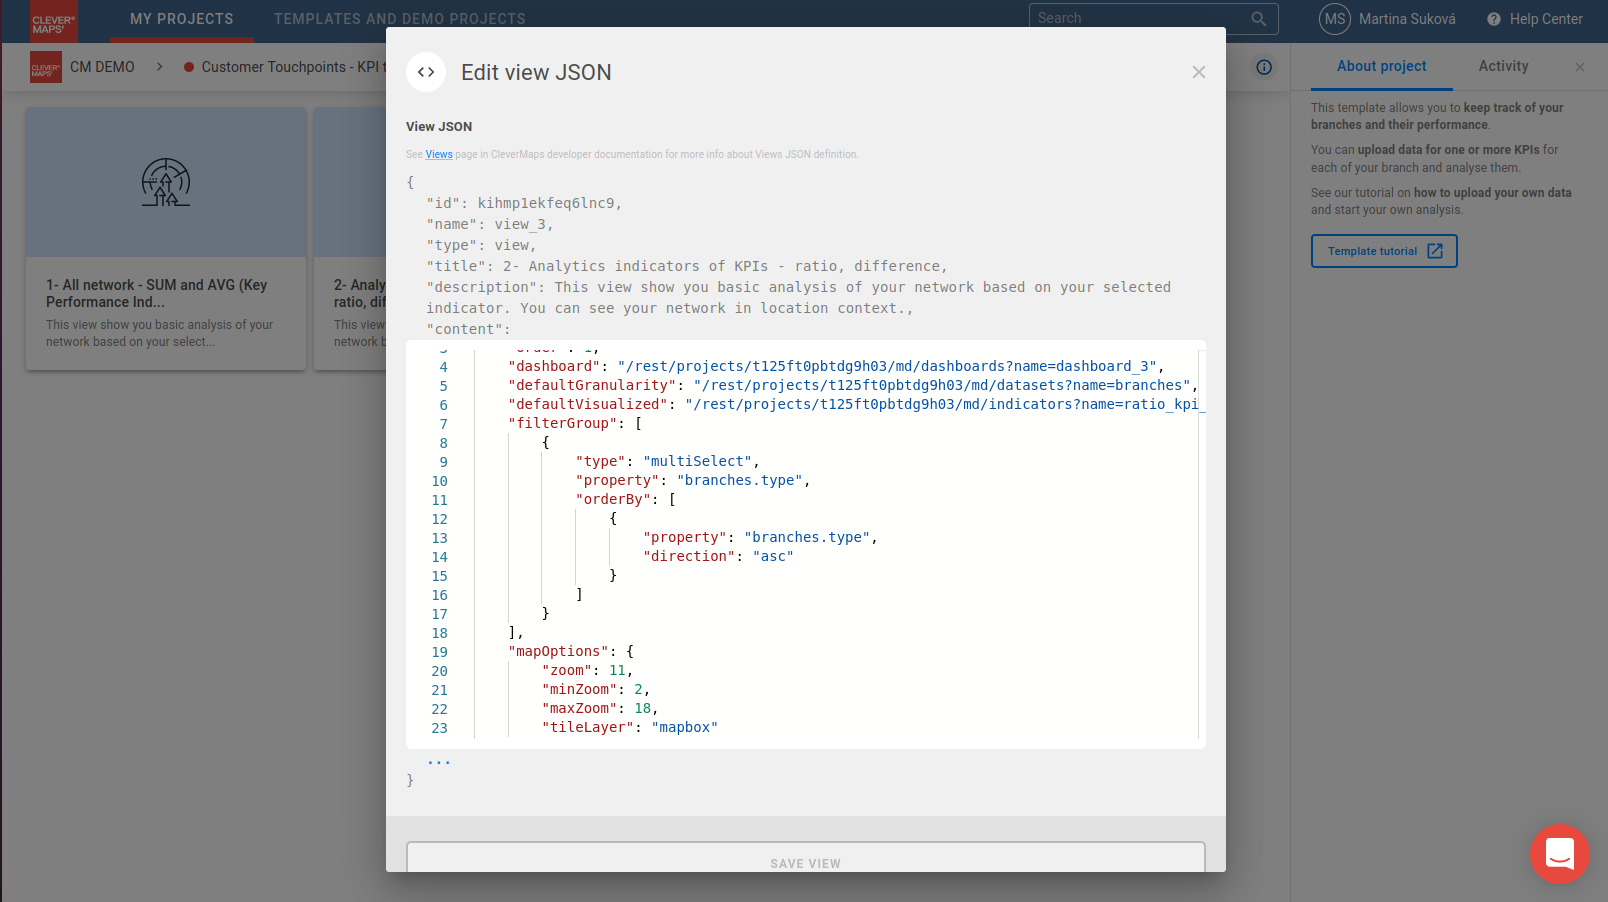
Filters can be added in the filterGroup section by adding atribute or indicator filter.
Example of an atribute filter:
{
			"type": "multiSelect",
			"property": "branches.type",
			"orderBy": [
				{
					"property": "branches.type",
					"direction": "asc"
				}
			]
		}
Example of an indicator filter:
 {
    "type": "indicator",
    "indicator": "/rest/projects/$projectId/md/indicators?name=turnover_indicator"
 }
How to analyze your data in Branches solution with KPIs
The great thing about our map is its interactivity. It is not a static picture to look at. Click on the Branches to get the value of the indicator. Look at the animation above how indicator values are dynamically recalculating based on selected branch or branches (by shift).
Or even you can select your branches by spatial query. For example, find out SUM of KPI 1 from branches in 36 km radius distance around town Hagen.
It is possible to set up your own filter to analyse your branch network. You can select only 1 type of shop and or shops with higher KPI 1 and low KPI 2. The indicators then display only branches which accept your conditions. For example, I would like to see only branches with high Turnover a low Costs.
You can see more complex analysis, which are represented as Ratio indicators ( KPI per other KPI), e.g. Turnover per customer. For example, you can find out branches which have Low Turnover per customer and High costs per customer.
You can find out percentage of your KPI created by specific branch in comparison to all network.
You can explore the area around your branches in Street View or Satellite map.
Or you can search your branch based on branch title or subtitle (id / name / address columns).