We highly recommend understanding Main Concepts first. (3 min read)
Hub to access thousands of relevant, reliable Data. Data are annotated and can be interactively filtered and searched. Both single dataset (table) or groups of related datasets are present (like a hierarchy of administrative regions). Data can be requested in various formats (csv, xlsx, geojson, shapefile, … and more) or in the form of CleverMaps dimension to be seamlessly imported into CleverMaps managed Data model.
What is Data Marketplace and why we created it?
The CleverMaps Data Marketplace is an entrance gate to the World of Location Intelligence, and that’s because every Location Intelligence analysis is dependent on the input data. Sometimes the internal data from your company (such as transactions) is enough, but for many use cases, such as Network Expansion or Site Selection, external data - points of interest, mobility data or demography data - is needed. When we started working on our platform, we soon discovered that the external geospatial data is inconsistent, not easy to find and quite often, it takes a long time to obtain it and prepare for your analysis. Also, you have to browse multiple data sources like statistical offices, European sources or even some private companies depending on the topic you want to work with. That is a standard we didn’t want to be part of.
CleverMaps Data Marketplace is a web portal aggregating all the external data we can use to support your business decisions. It contains data created and curated by the CleverMaps team and data from our data partners that we have successfully incorporated into our platform. When considering Location Intelligence, the most significant advantage of our Marketplace is that all the data is prepared to be visualized either on the level of an administrative unit (such as municipalities or even statistical sectors) or with alternative visualizations like the H3 grid or heatmap. Each dataset also contains the granularity it is aggregated to, an example of its visualization in CleverMaps and a sample of the data in a tabular form. And finally, you only need to browse one portal to find data from various sources. For a detail of the content, please read the chapters below.
What it contains?
As mentioned above, the Data Marketplace disposes of all the data you need to solve your use case. But what is it exactly? Well, there are two main types of data in the Marketplace - Dataset and Dimension.
Dataset is a plain file, usually in a CSV format (but we can also deliver other formats; see below), that you can incorporate straight into your analysis. It is usually prepared in a structure that allows for a quick import into the CleverMaps Studio, but when you purchase a dataset, and you don’t need it to be visualized in a map, there is no obligation to use it with CleverMaps. Simply purchase your data, and you are good to go!
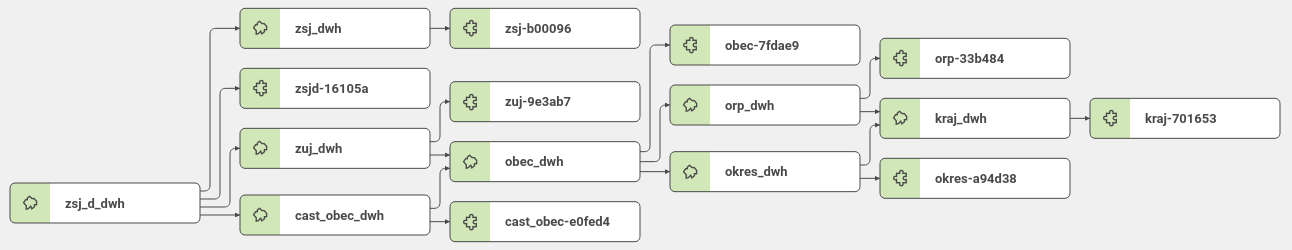
Dimension is a little different story. It is a set-up project with a data model in the CleverMaps platform ready to be used as a basis for your Location Intelligence analysis. It consists of multiple datasets connected via primary and foreign keys. It fully uses one of the biggest advantages of CleverMaps - the Semantic Layer and the logical multidimensional data model. Dimension has its data model ready and allows you to kickstart your project. The most typical dimension we offer is the Administrative units of a country of your choice. You can see a data model of the dimension containing the administrative units of the Czech Republic in the picture below. Dimensions are very easily importable into your CleverMaps project - for more information about that, please head to the chapter The ways of delivery and formats.
So, which one of the Datasets or Dimensions will you need for your analysis? Usually, it’s going to be both. Imagine you would like to visualize the population and its purchasing power on various granularities. For that, you will need the Administrative units dimension and then the datasets to be visualized on it - Demography and Purchasing power. All of that can be found in our Data Marketplace. Continue reading if you would like to know the easiest way to find what you’re looking for!
How to find what I’m looking for?
Since there are thousands of items in the Data Marketplace, you need a quick and easy way to find whether your desired data is available. There are two ways to do that: filtering in the left menu or searching through the search bar. Let’s go through them very quickly and explain their pros and cons.
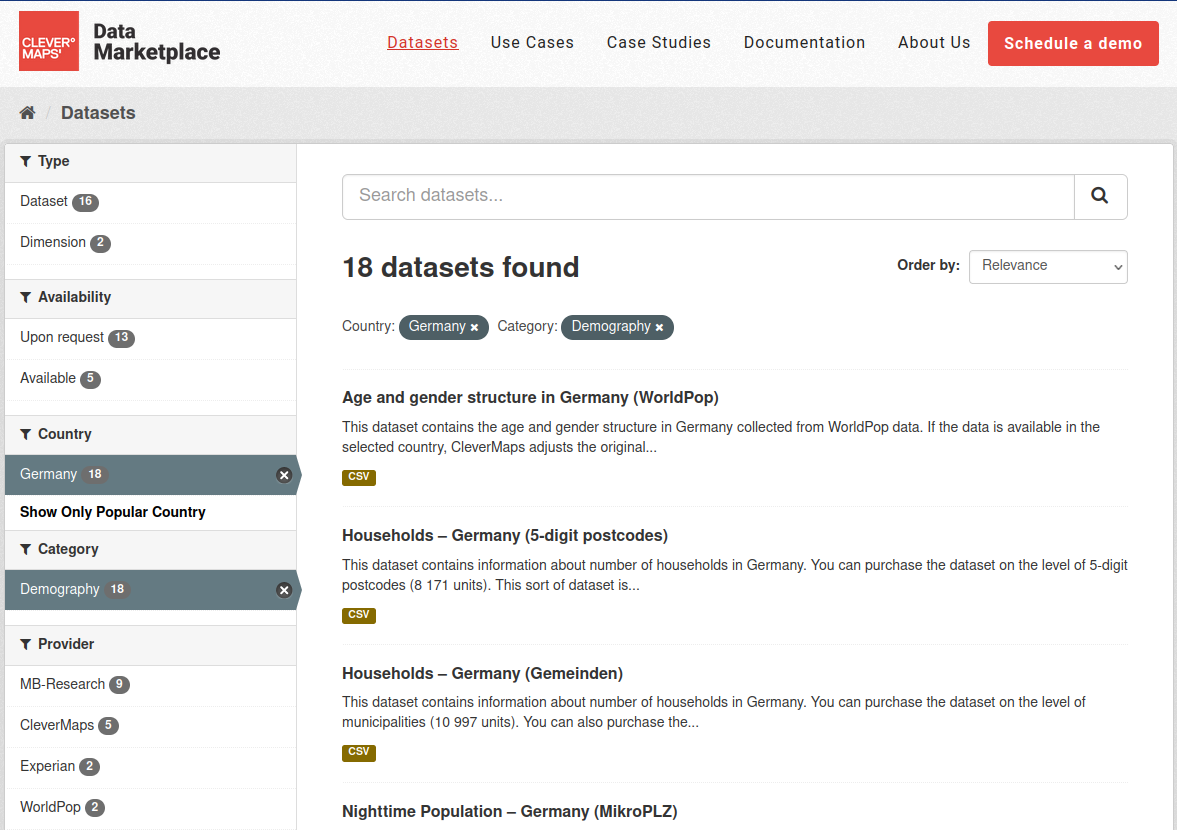
You probably reached the Marketplace with the purpose of finding specific data, such as the population in Germany. The menu arrangement on the left is supposed to make this search as easy as possible. On the top, you can see how many datasets and dimensions are available and how many of them are available upon request. However, you are interested in the categories below that - Country and Category. Based on our desired data, I can now look for Germany in the Countries selection and select Demography from the present categories. Straightaway I can see what data is available, who the provider is and a few more information that can be valuable.
Another way how to reach this is to search through the search bar. This method is advantageous with specific datasets (which is our case), but when you feel a bit insecure about what exactly you are looking for, we would suggest going with the filtering method. However, here you can type the keywords of your search into the search bar, and after inputting “population Germany” into the search bar, you’ll get the desired outcome as well. Just keep in mind that the search bar works the same way as other web search engines - it returns everything that has something to do with the input. It is therefore recommended to narrow down the search results by filtering through the left panel, which we have explained in the previous paragraph. This way, you can effectively combine both ways of searching and get to the desired items in little to no time.
Deep dive into the dataset detail
When you find what’s relevant for you, you will probably like to know a little more about the dataset or dimension, such as its detail, the time of the last update etc. To find out, click on the dataset title (the one in bold) to get into the dataset detail.
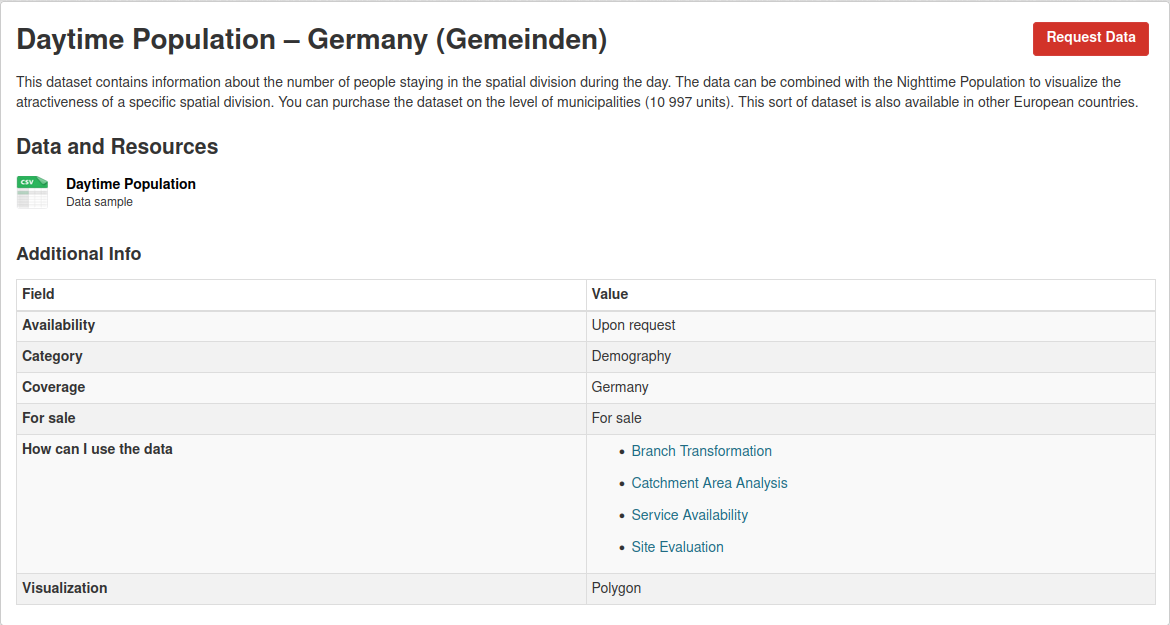
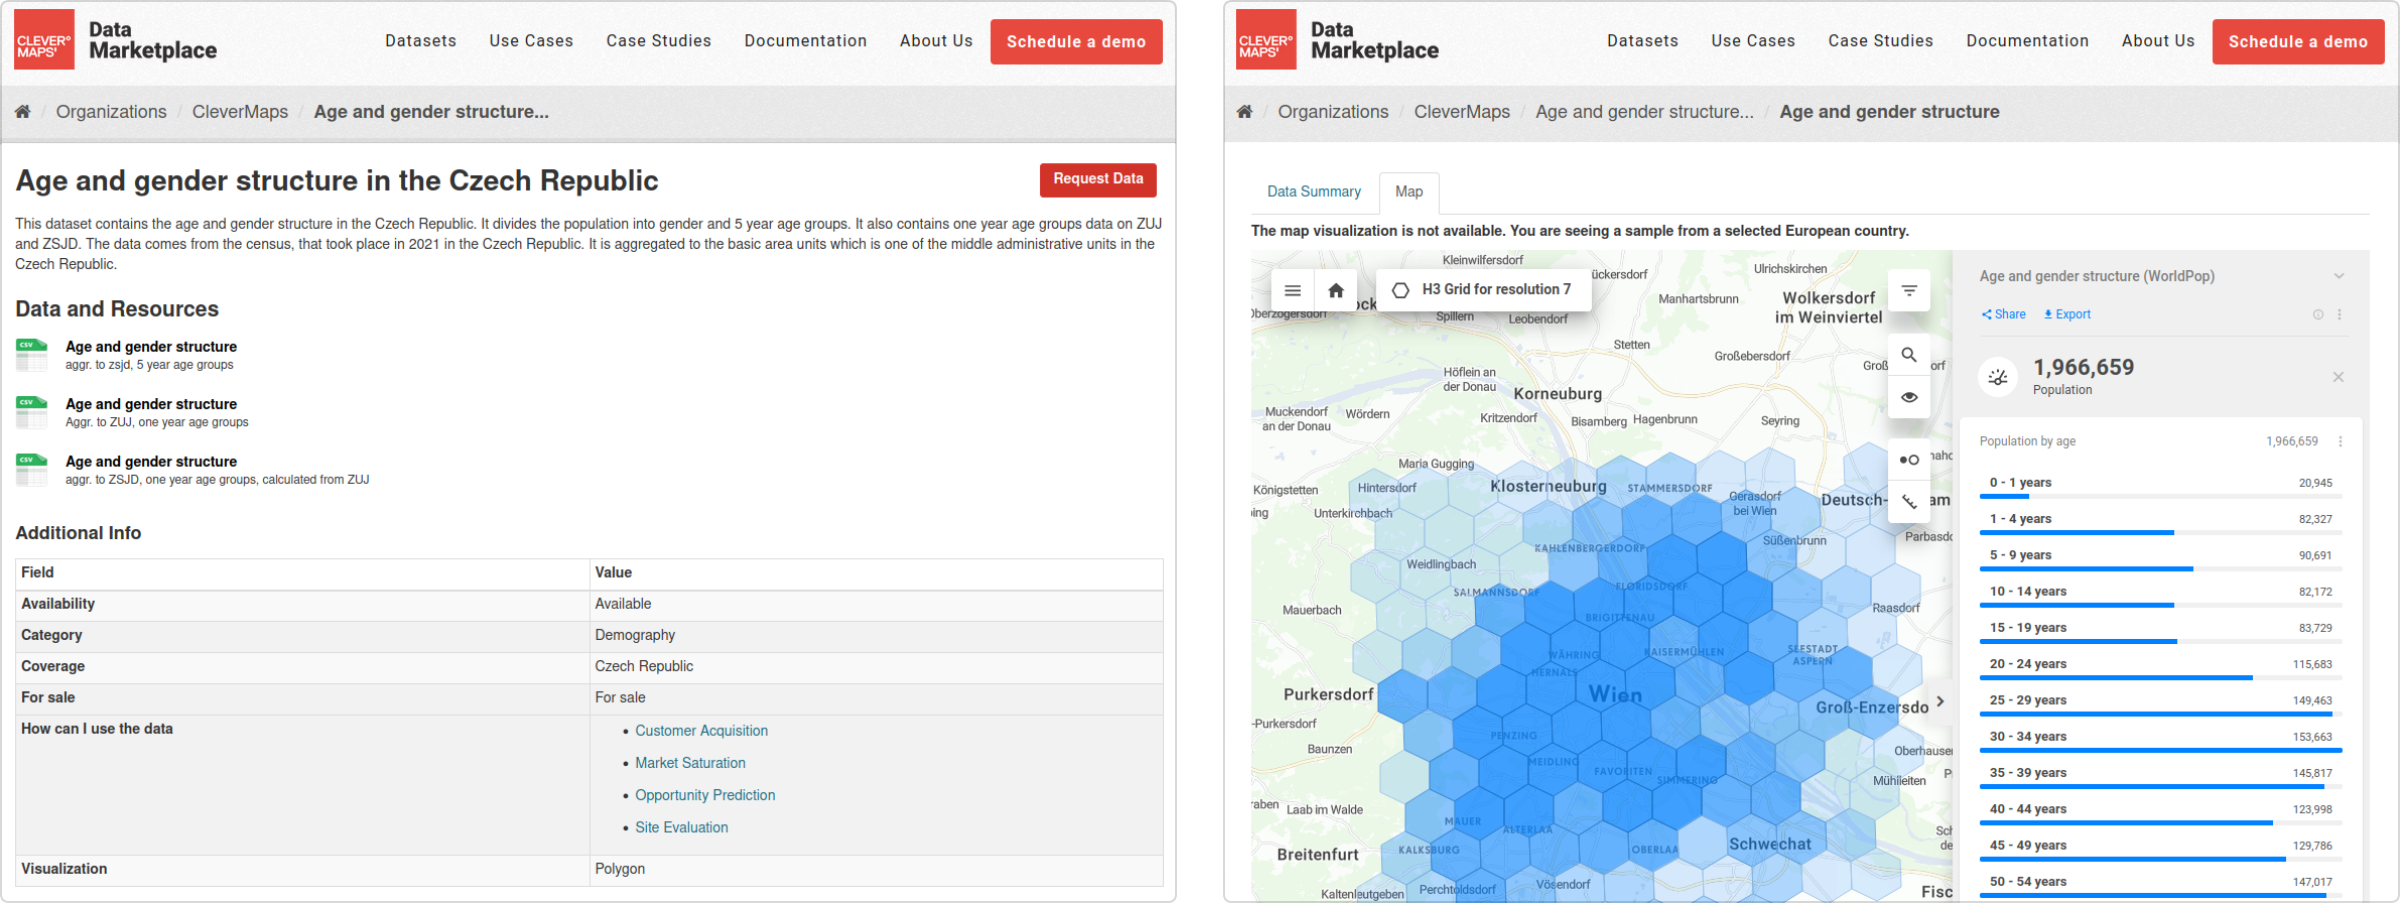
The dataset detail page will allow you to read the full description, see whether the data is available straightaway, and what kind of use cases it is useful for. But most importantly, after clicking the CSV icon under Data and Resources, it offers a way to see the data structure and how the dataset looks in action in CleverMaps, allowing you to estimate the dataset detail better.
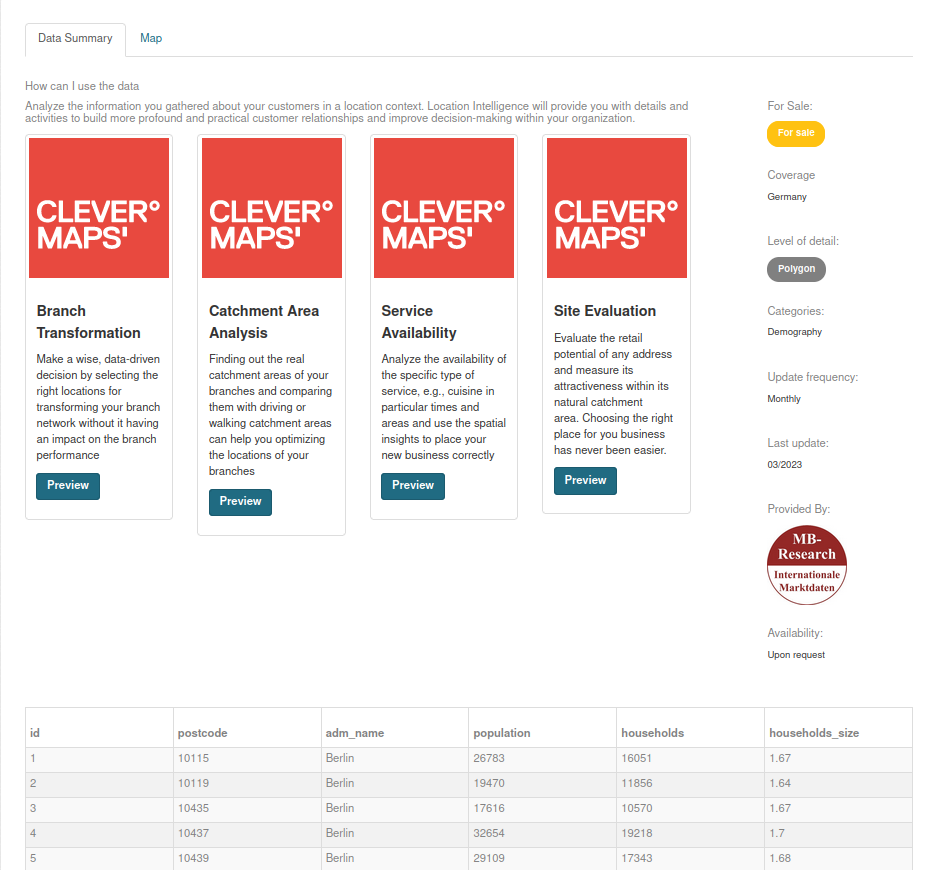
The data file detail disposes of two tabs - Data Summary and Map (in the case of Data Dimensions, it’s only the Map tab since the Data Dimension consists of multiple datasets). The first tab that you can see in the picture above offers a better breakdown of the use cases the dataset is suitable for, and then also a sample of 10 rows to see the data structure. The other tab, called Map, will allow you to see the dataset being used in a CleverMaps project. If you later decide to visualize the dataset in the CleverMaps Studio, this is what the visualization will look like.
How to purchase the data?
There are two ways to transform your search into a data order. The easiest one is clicking on the “Request Data” button on the dataset detail page. This will redirect you to an order form with some prefilled information. You will only need to input your personal details, add Notes if you like and then submit the order. After that, you will receive the invoice, and the Professional Services team will prepare the data delivery.
In case you feel like your project will be a little more complicated, you can use the Data Marketplace to gain a better overview of what’s available for your target geography and use case and then contact the Sales Team at sales@clevermaps.io to help you with finalizing the order. The Sales team can also recommend you some more potentially valuable data or be on hand when anything else is needed.
The ways of delivery and formats
The data delivery will differ between the Datasets and Dimensions because the Dimensions are strictly bound to use in the CleverMaps Studio, whereas the Datasets can also be delivered in a plain file in various formats. So the Dimension will always be delivered to you as an invitation to a project in CleverMaps Studio. After accepting the invitation, the data is yours, but you are not allowed to use it outside CleverMaps, as per our licence.
The Datasets can be delivered in a variety of ways. The vast majority of the data we are offering is prepared as a CSV file for quick integration into the CleverMaps Studio, and therefore CSV is going to be the most common format for data delivery. However, if you need a different format, our Professional Services team is always at your service and is prepared to deliver data in other formats like JSON, GeoJSON, Shapefile or XLSX file. Describe your needs in the order form and we will do our best to fulfil them.
Regarding the data transfer, the data will be delivered through the AWS S3 bucket. This will allow you to download the data at your convenience quickly and easily. Should there be a need to transfer the data differently, please specify that again in the order form.