This tutorial will walk you through the process of creating a new project, writing basic project metadata and loading your data into the project.
Chapter summary
What you'll create
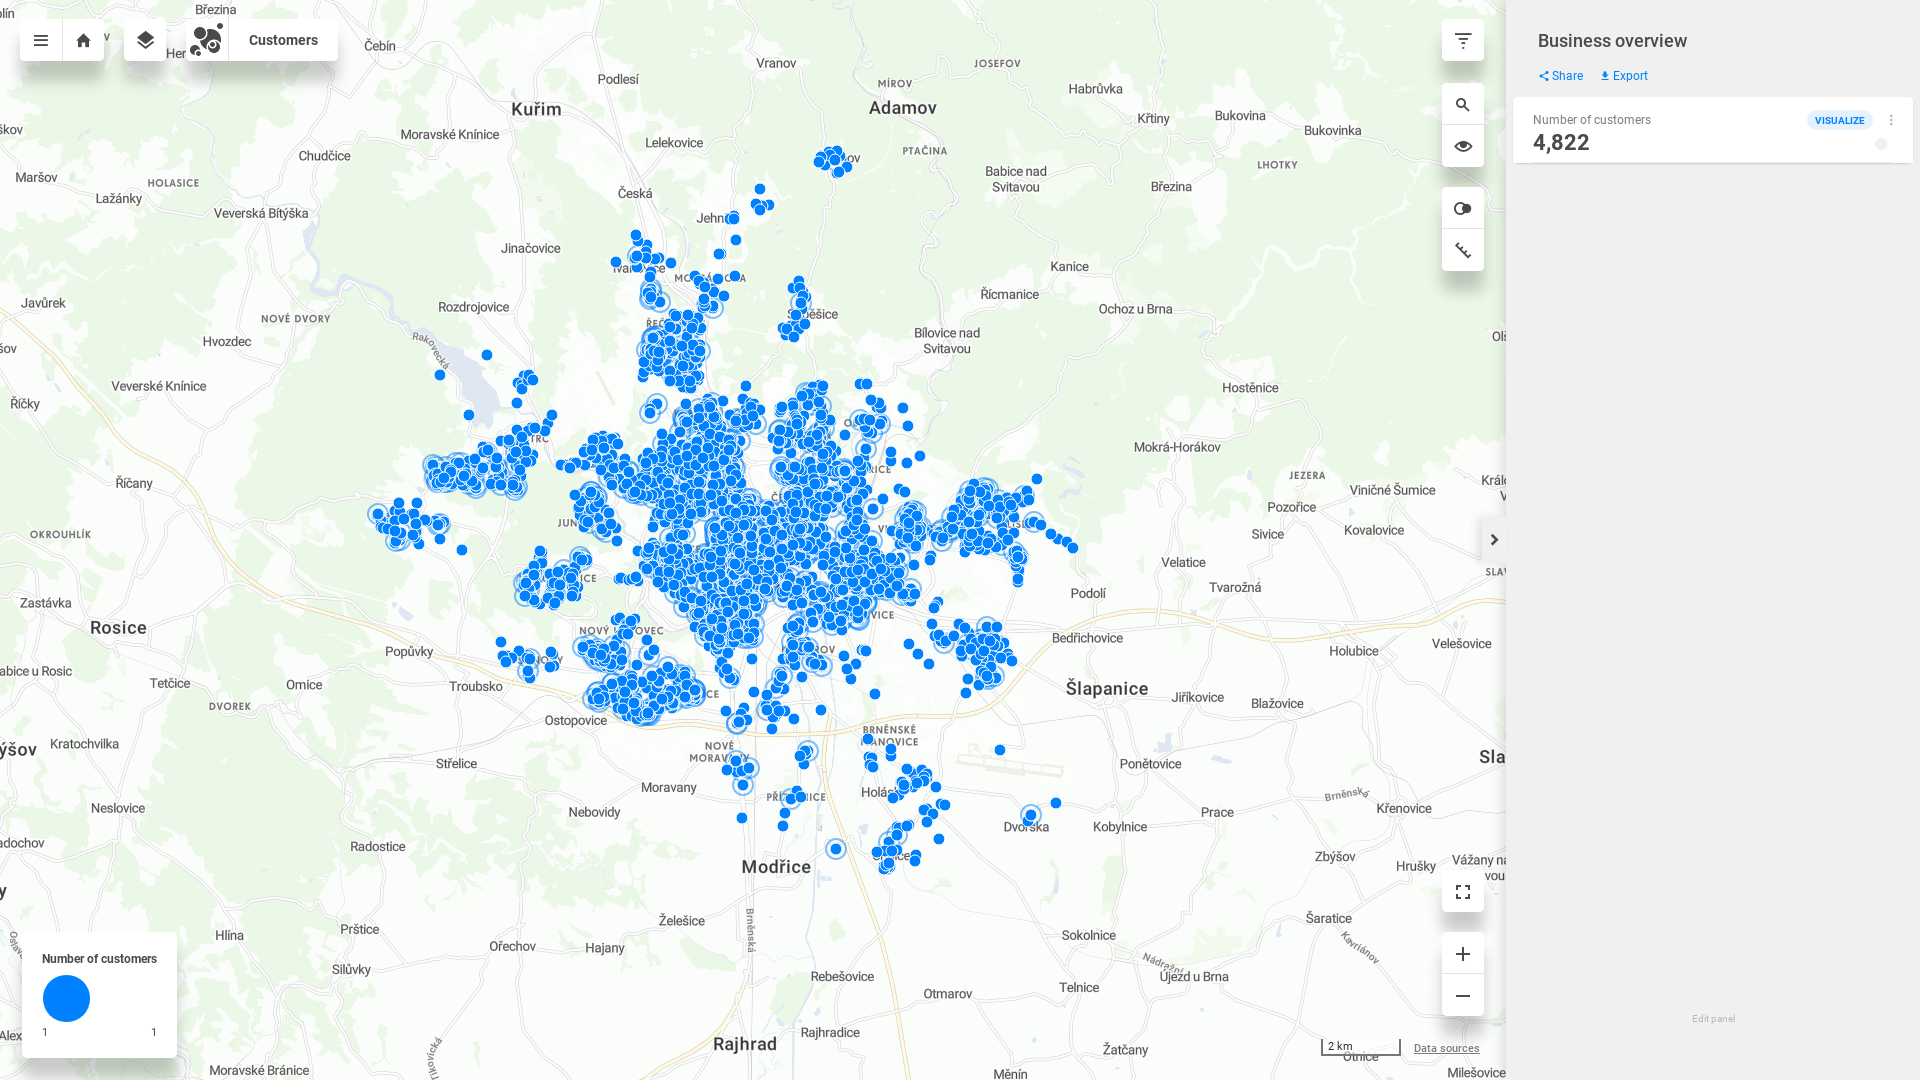
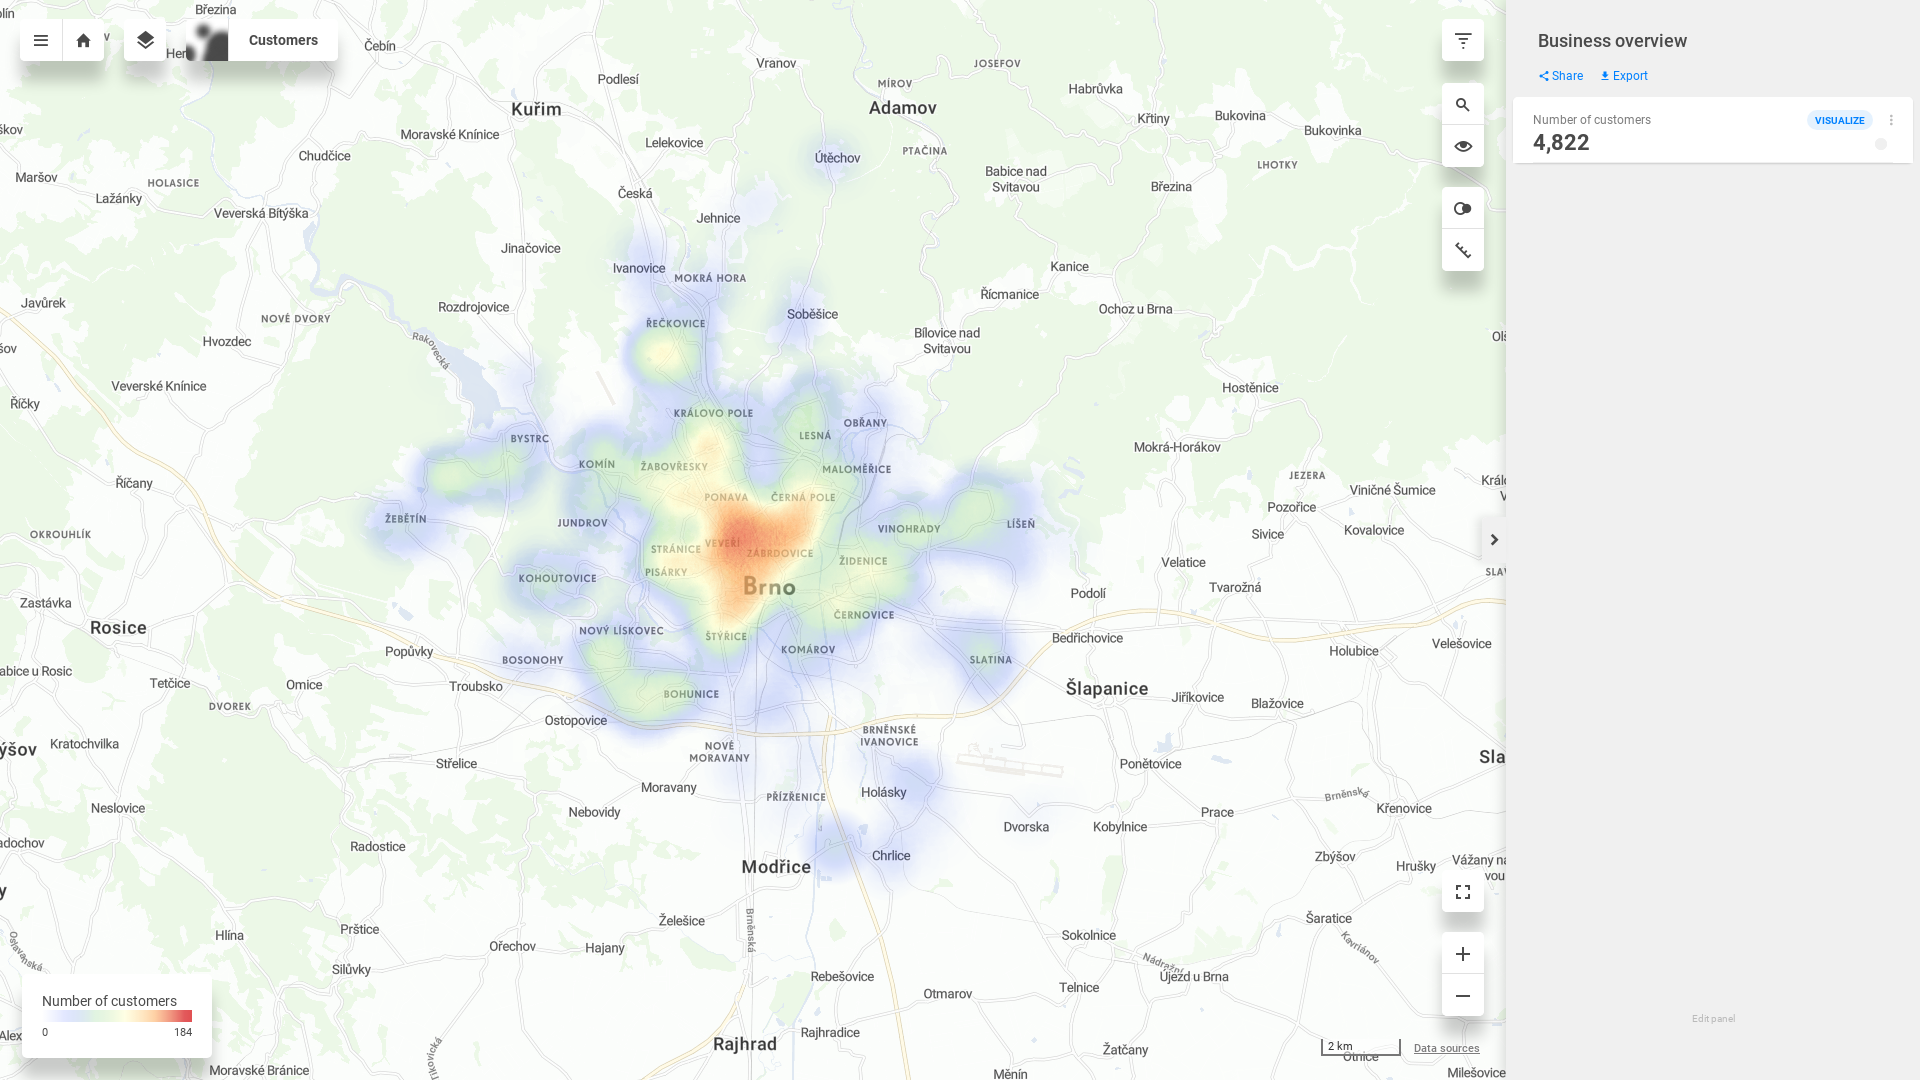
A simple CleverMaps project visualizing your clients' addresses on the map. We'll do that using 2 visualizations - dotmap, and heatmap.
|
Clients visualized using dotmap |
Clients visualized using heatmap |
|---|---|
|
|
Prerequisites
You can complete this tutorial if:
-
you have a CleverMaps account
-
you have downloaded CleverMaps Shell and have successfully run it
Let's jump right in and learn how to create your own CleverMaps project.